📈 Rental Analysis
In this section, our objective is to examine the factors that influence rental prices. We will analyze location factors and other relevant variables to gain insights into their impact on real estate prices.
📍 Location
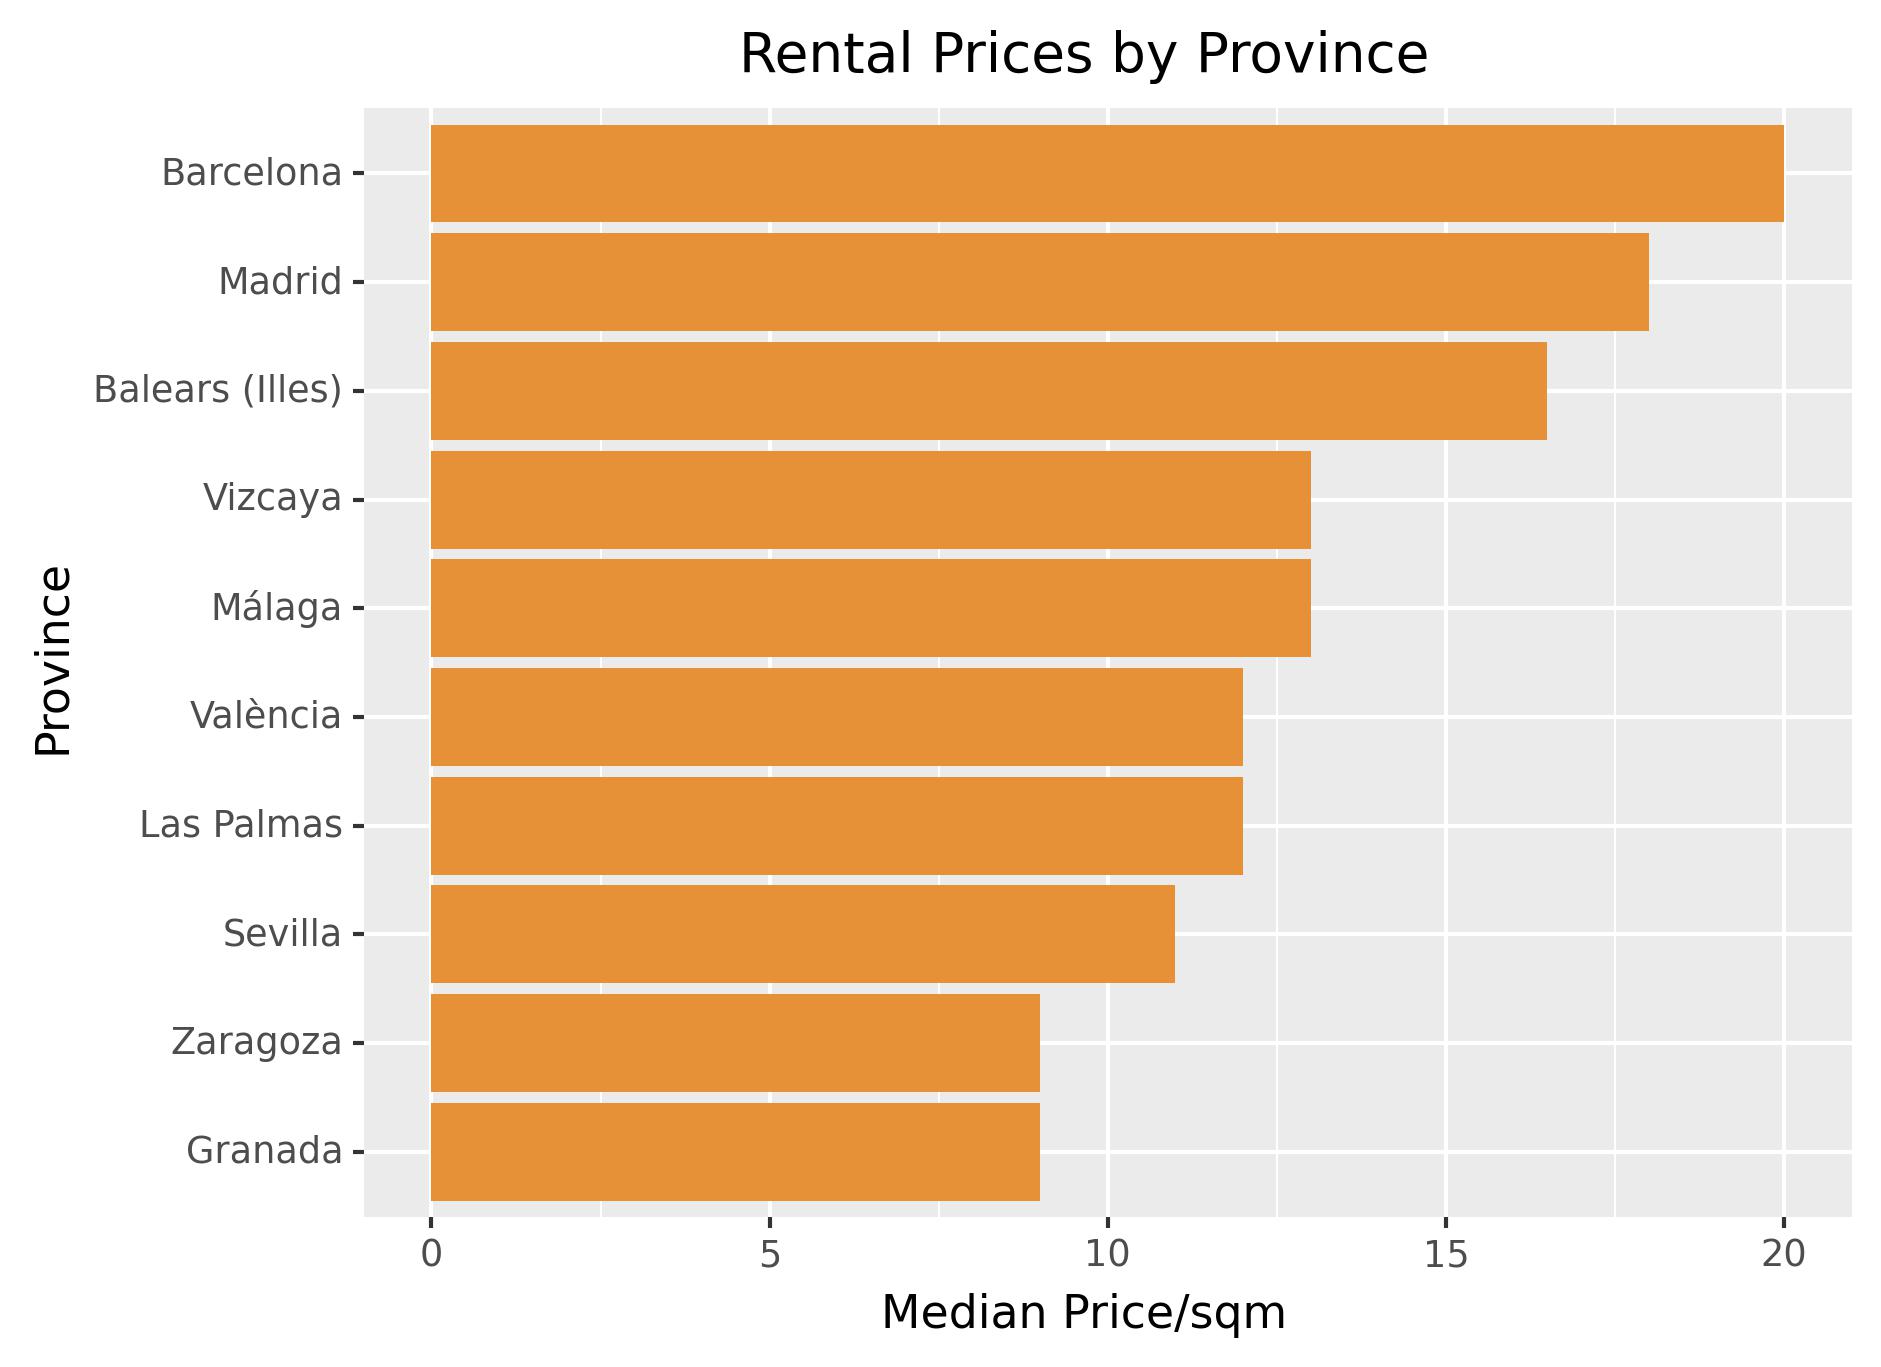
Variations in Rental Price across Provinces
This analysis examines the variations in rental prices across different provinces in Spain. Understanding the disparities in rental prices can provide valuable insights into regional affordability, demand-supply dynamics, and potential investment opportunities.
Furthermore, we investigated other factors such as population density in the price variation in these cities as we suggested the significance of influx of residents above. By comparing across the 10 cities with data from external source, we have seen a moderate to weak correlation in population density to prices. Due to the weak correlation, population density cannot be identified as the main factor contributing to price variation. Further investigation will be conducted in subsequent sections to explore its potential influence on real estate prices.
Proximity to City Centre
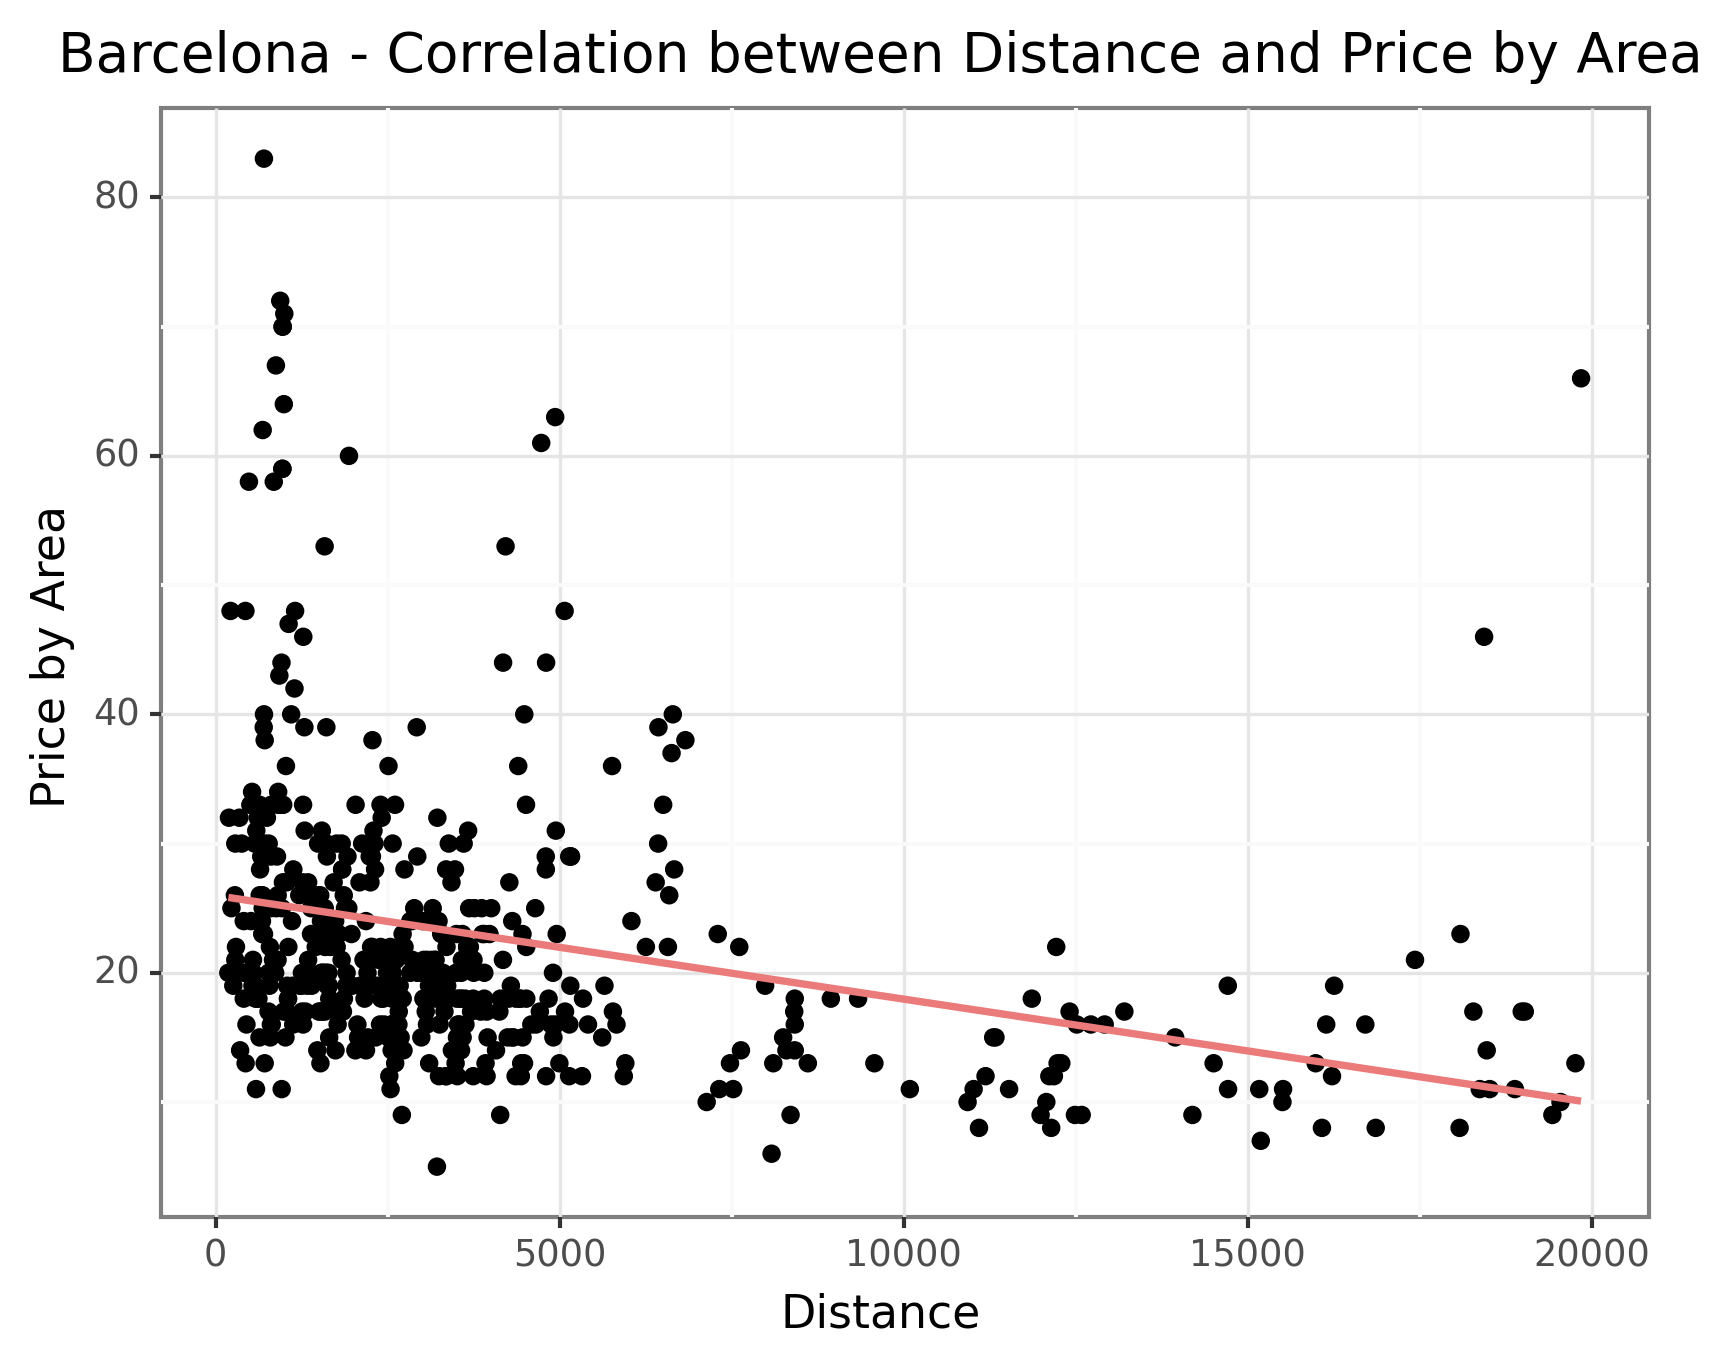
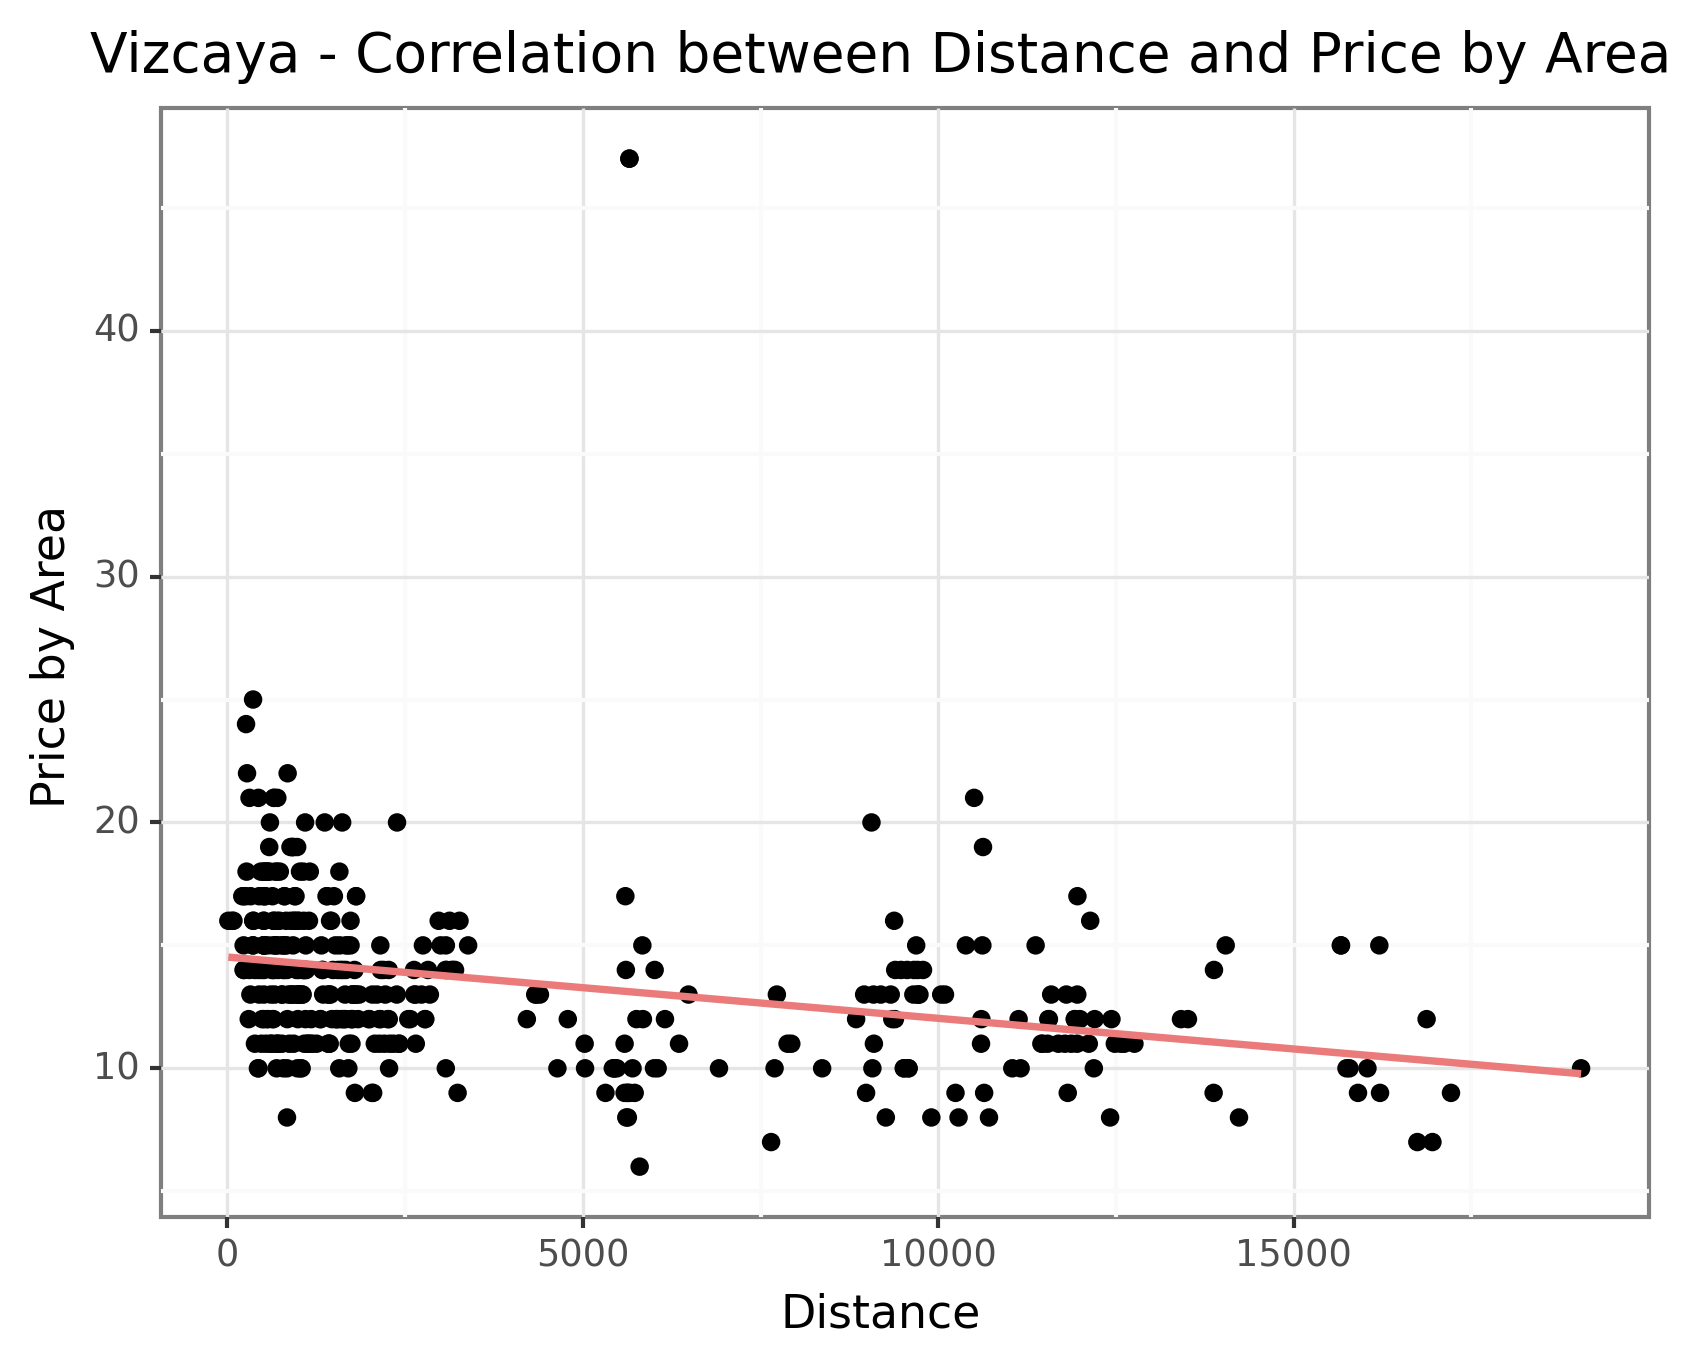
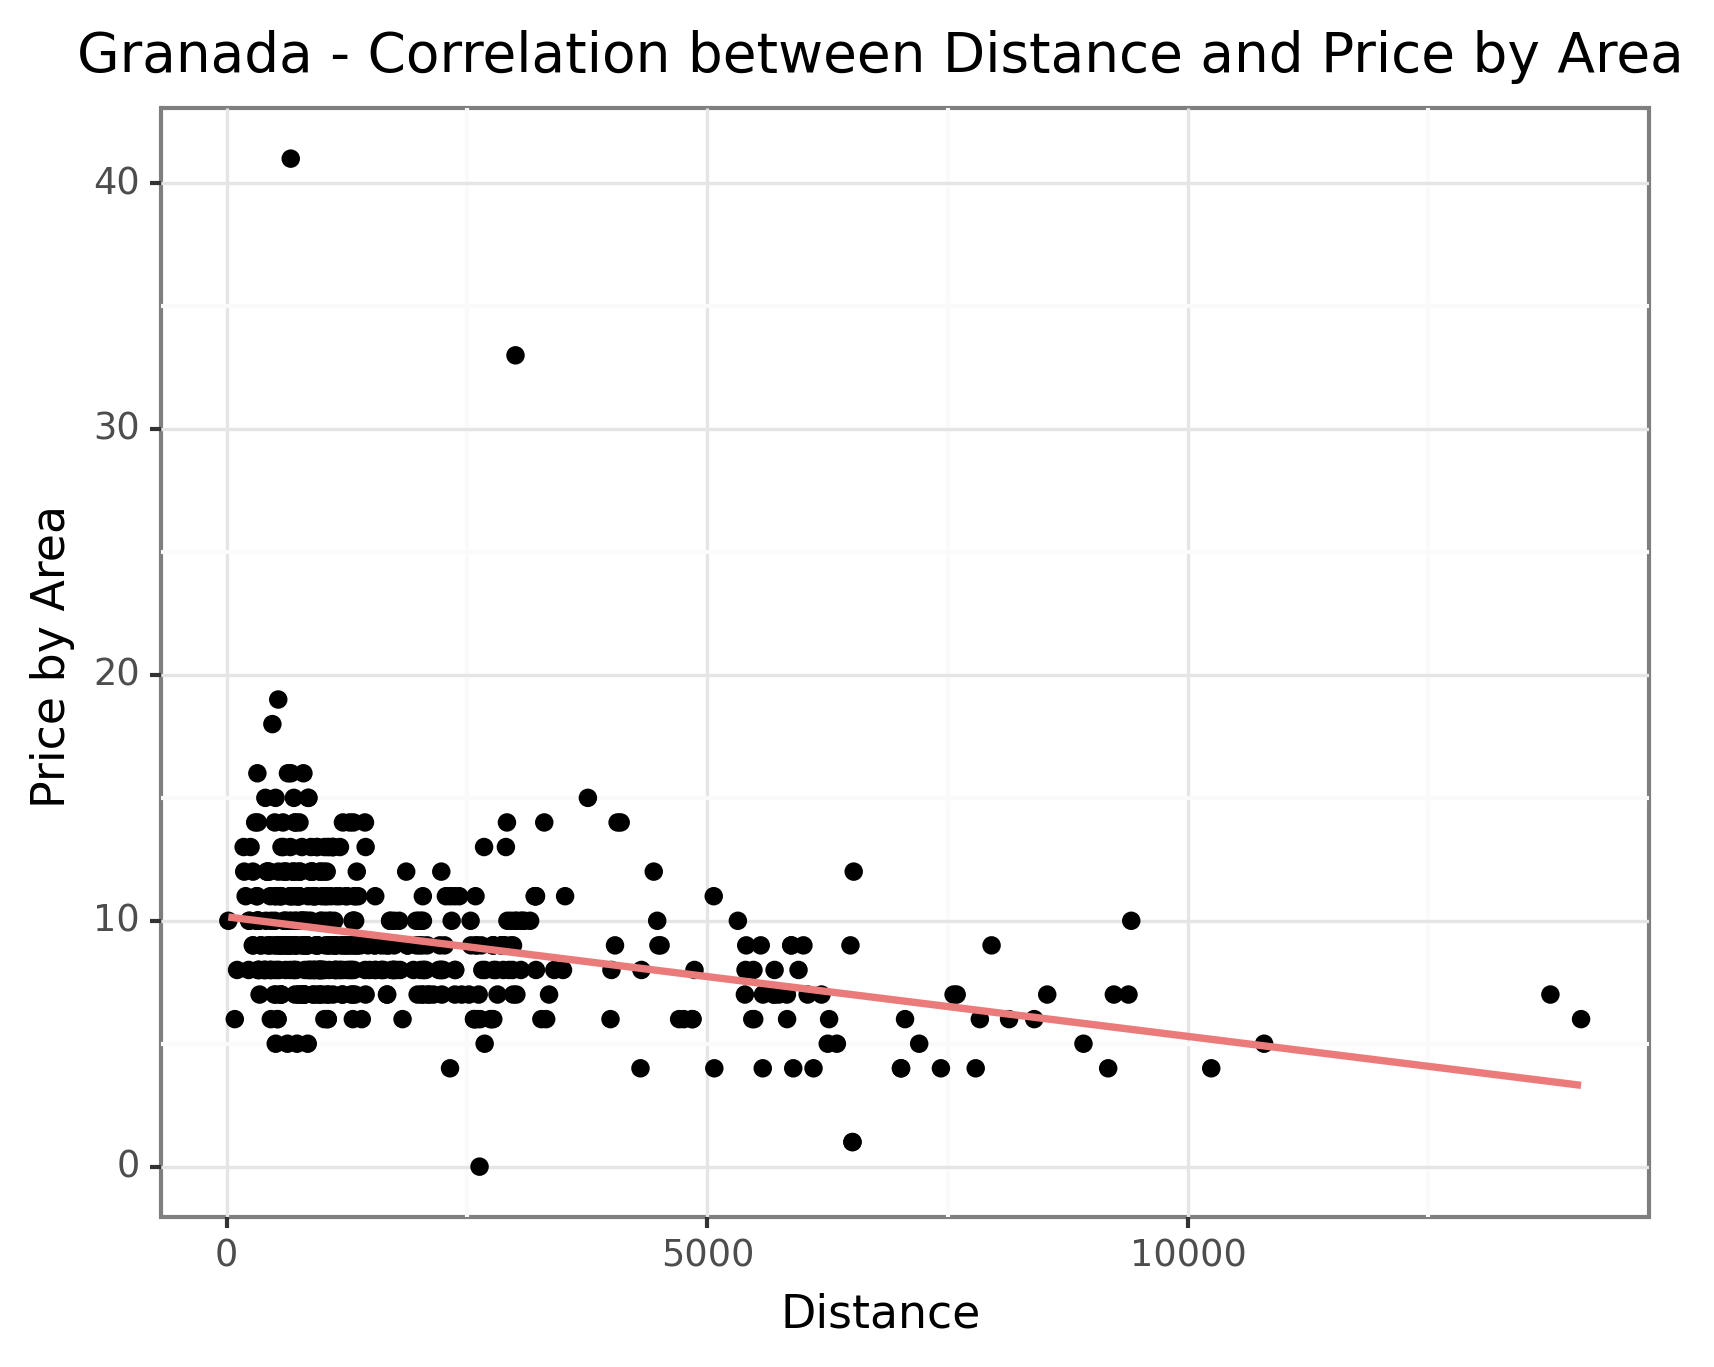
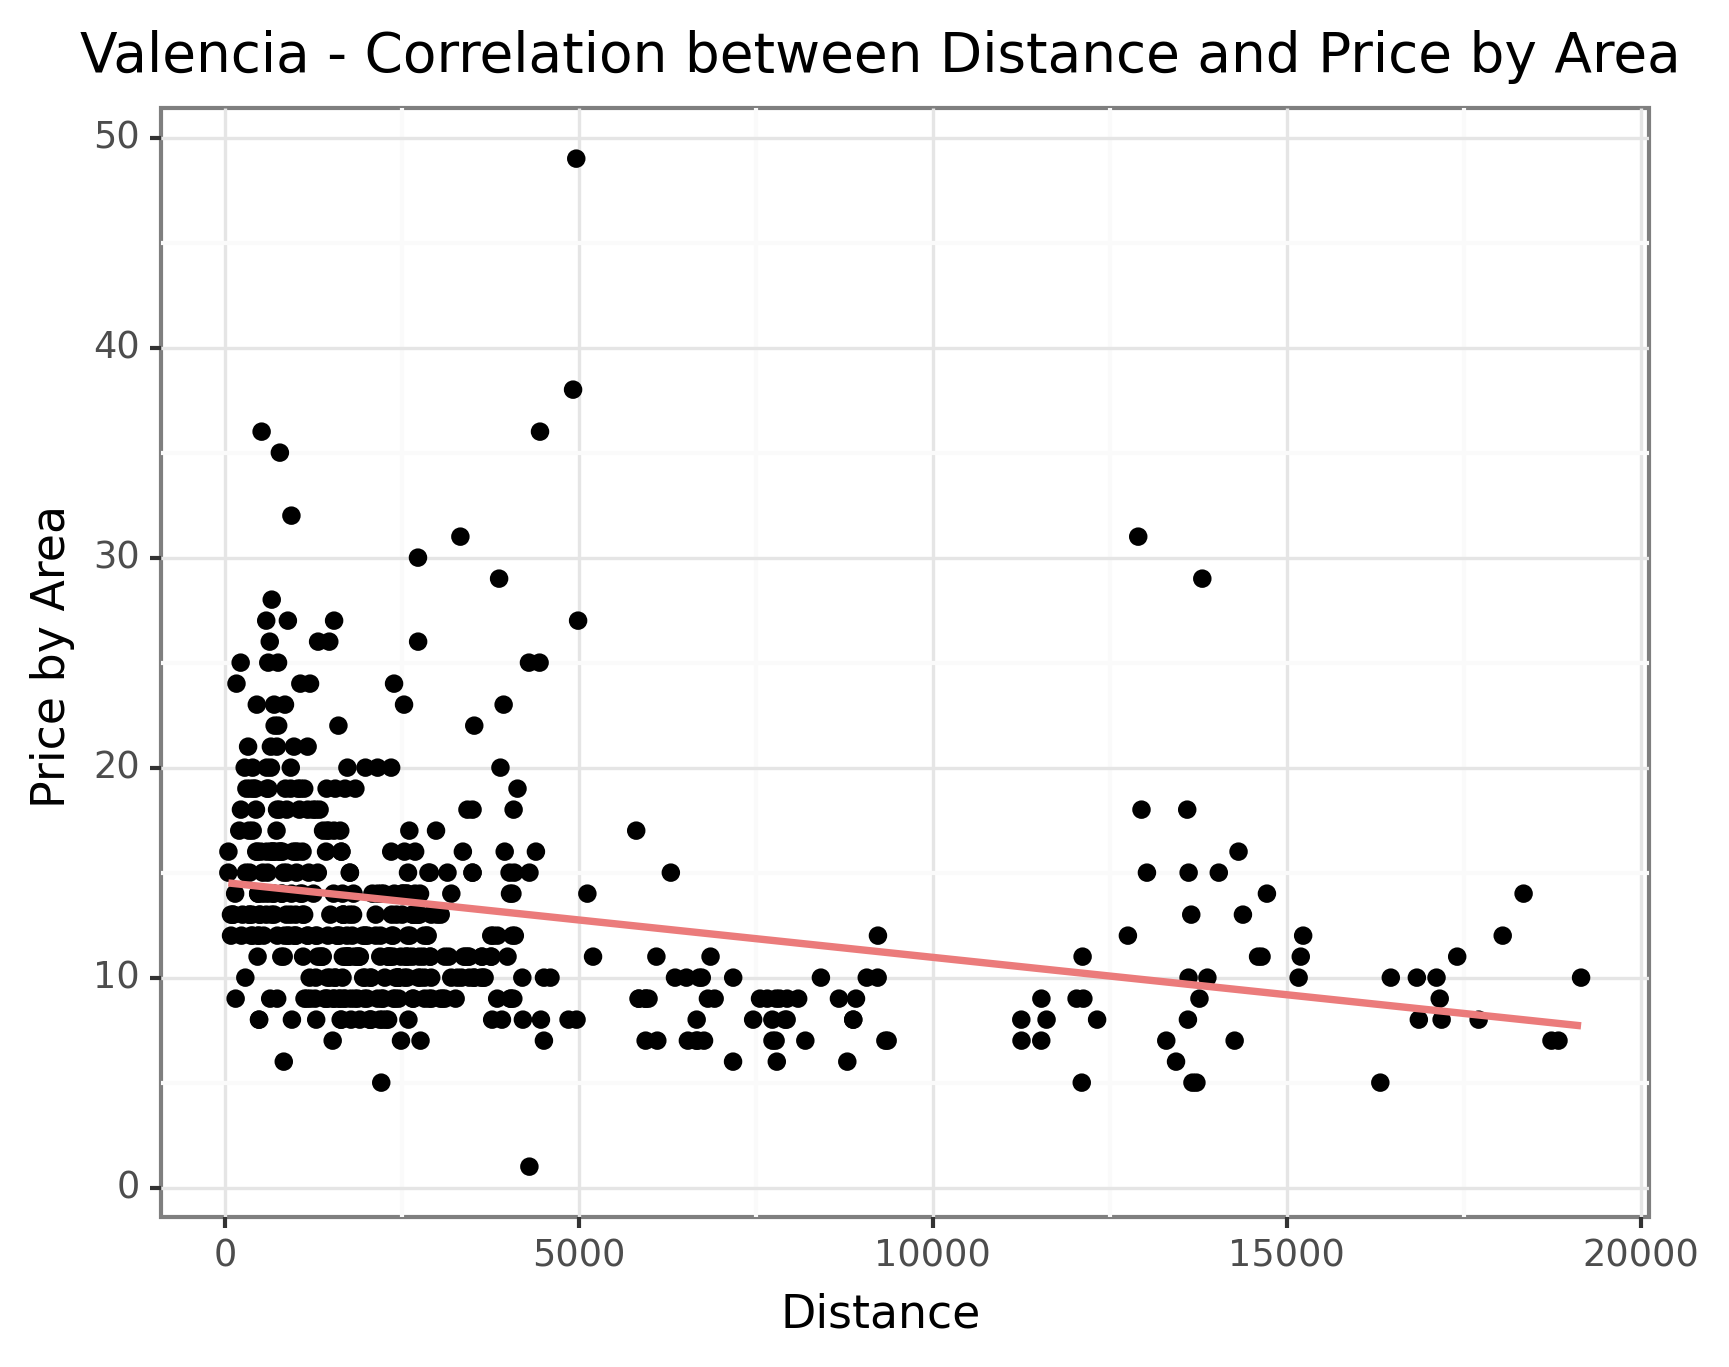
This analysis investigates the distribution of rental prices based on their proximity to the city center. By analyzing rental price variations at different distances, it allows for an understanding of how location impacts rental prices and provides insights into the rental market dynamics within urban areas.
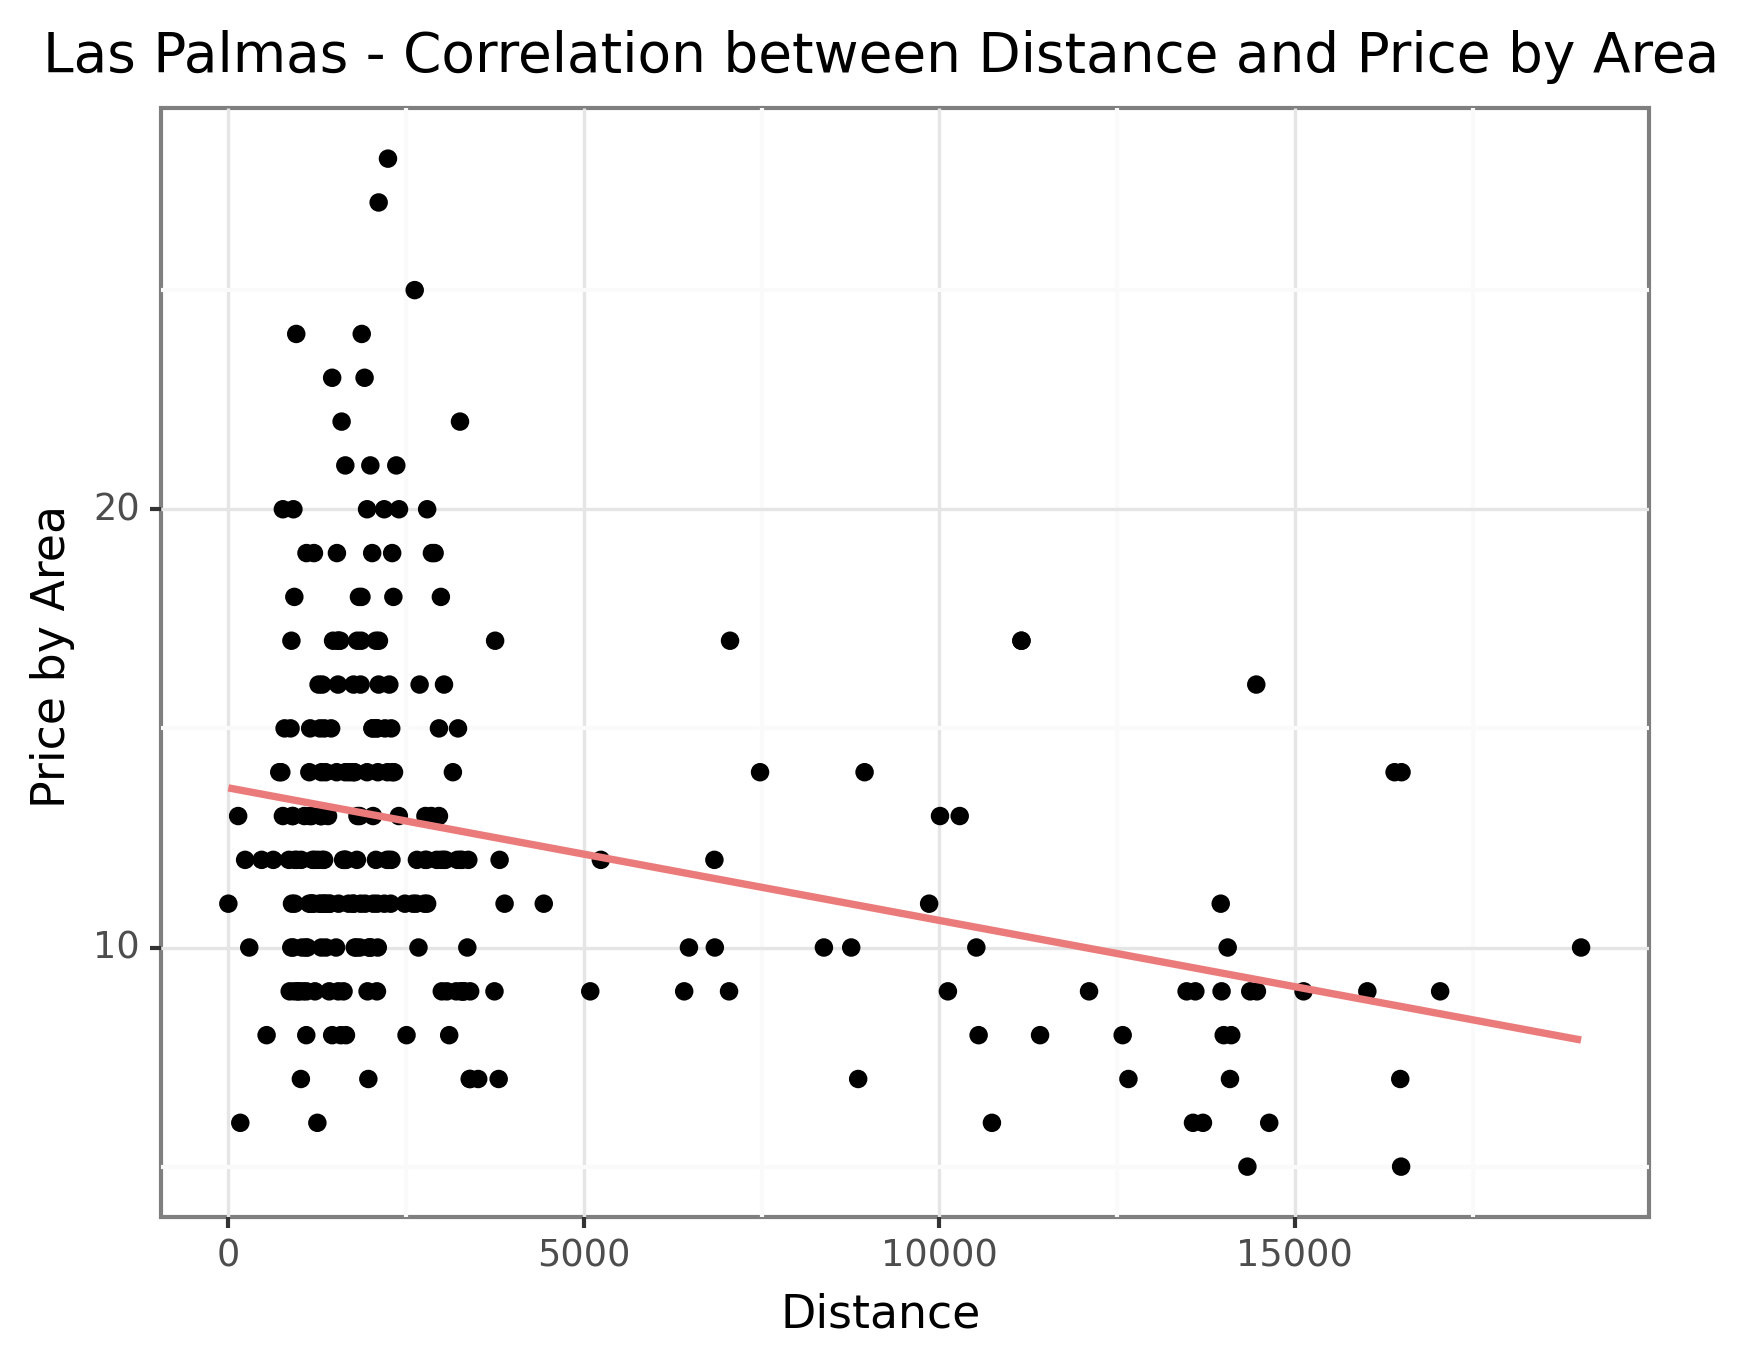
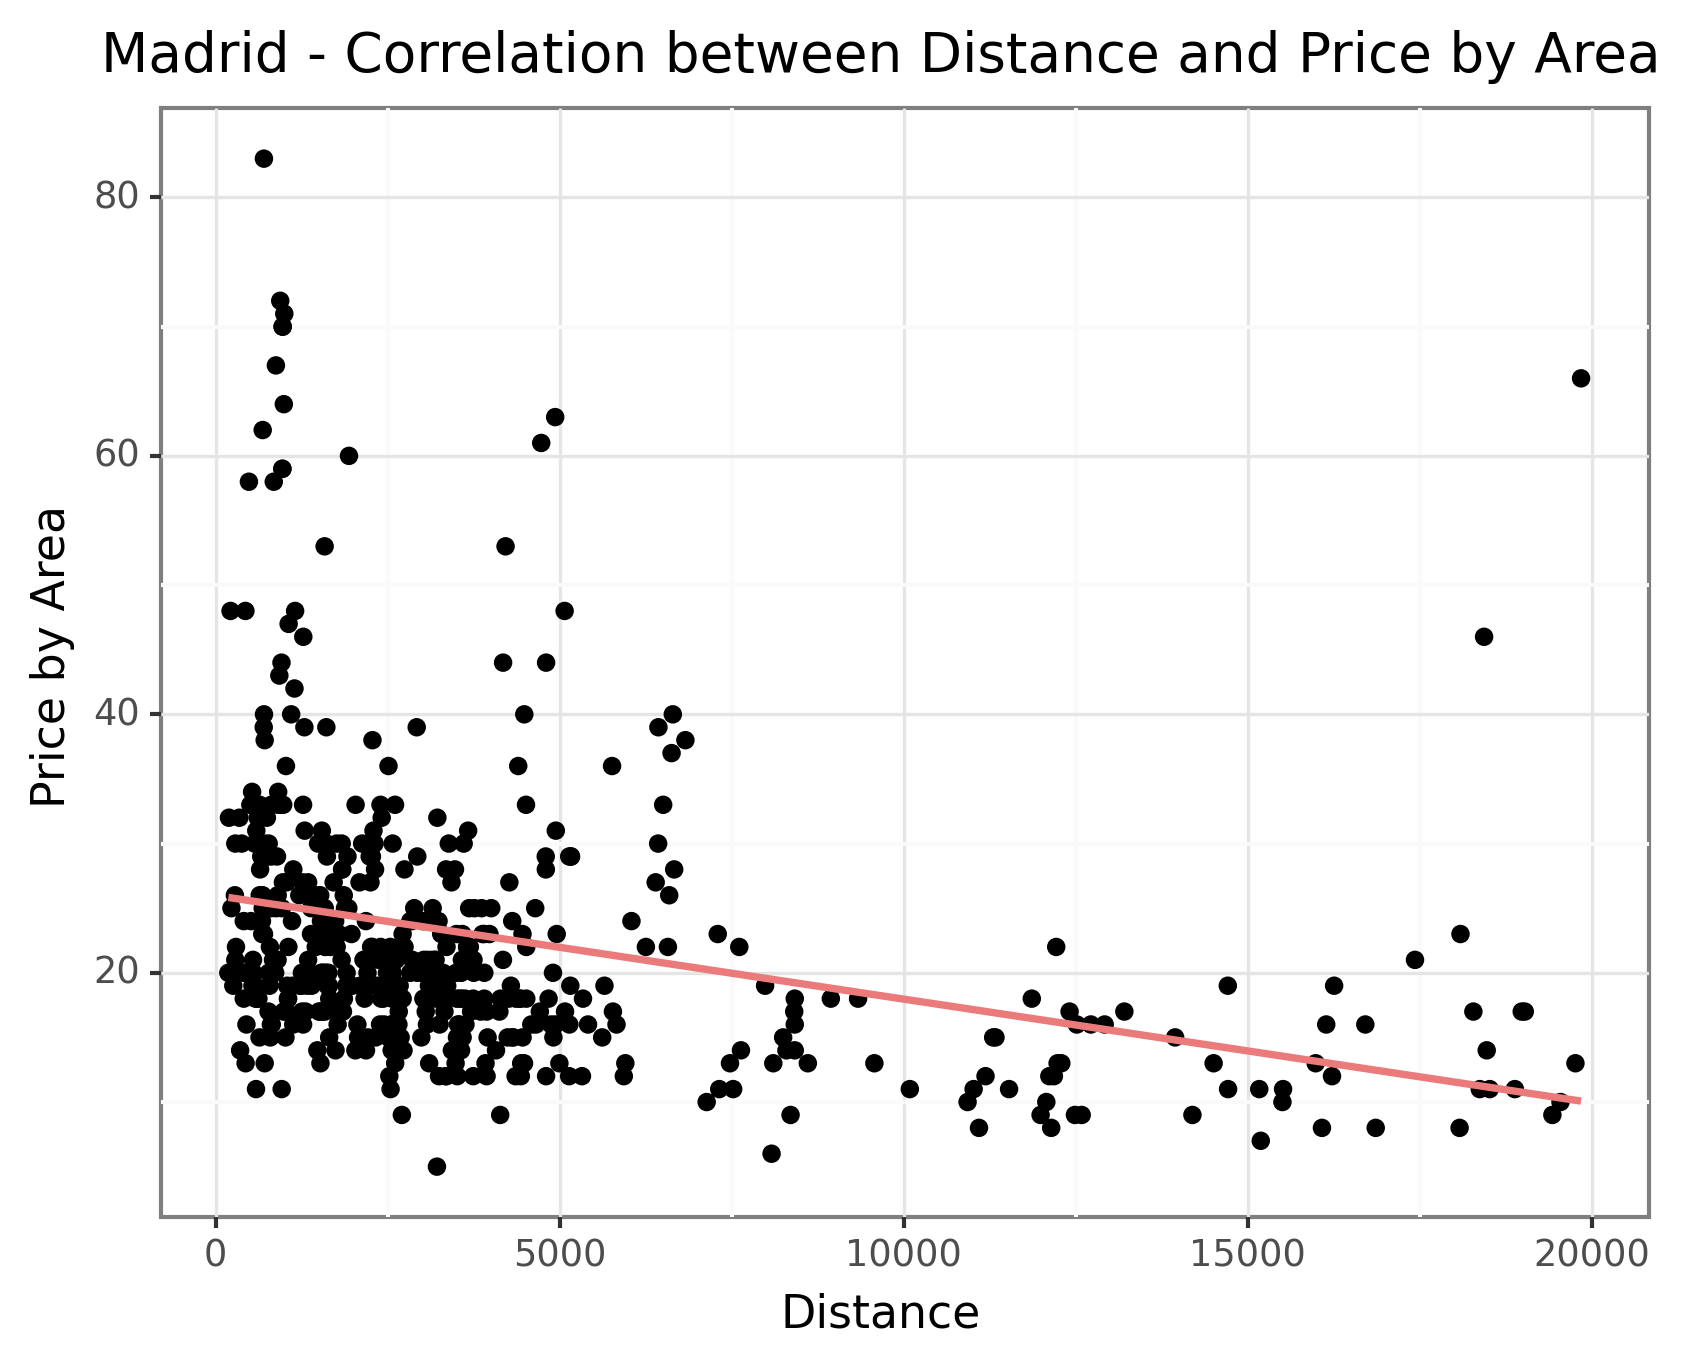
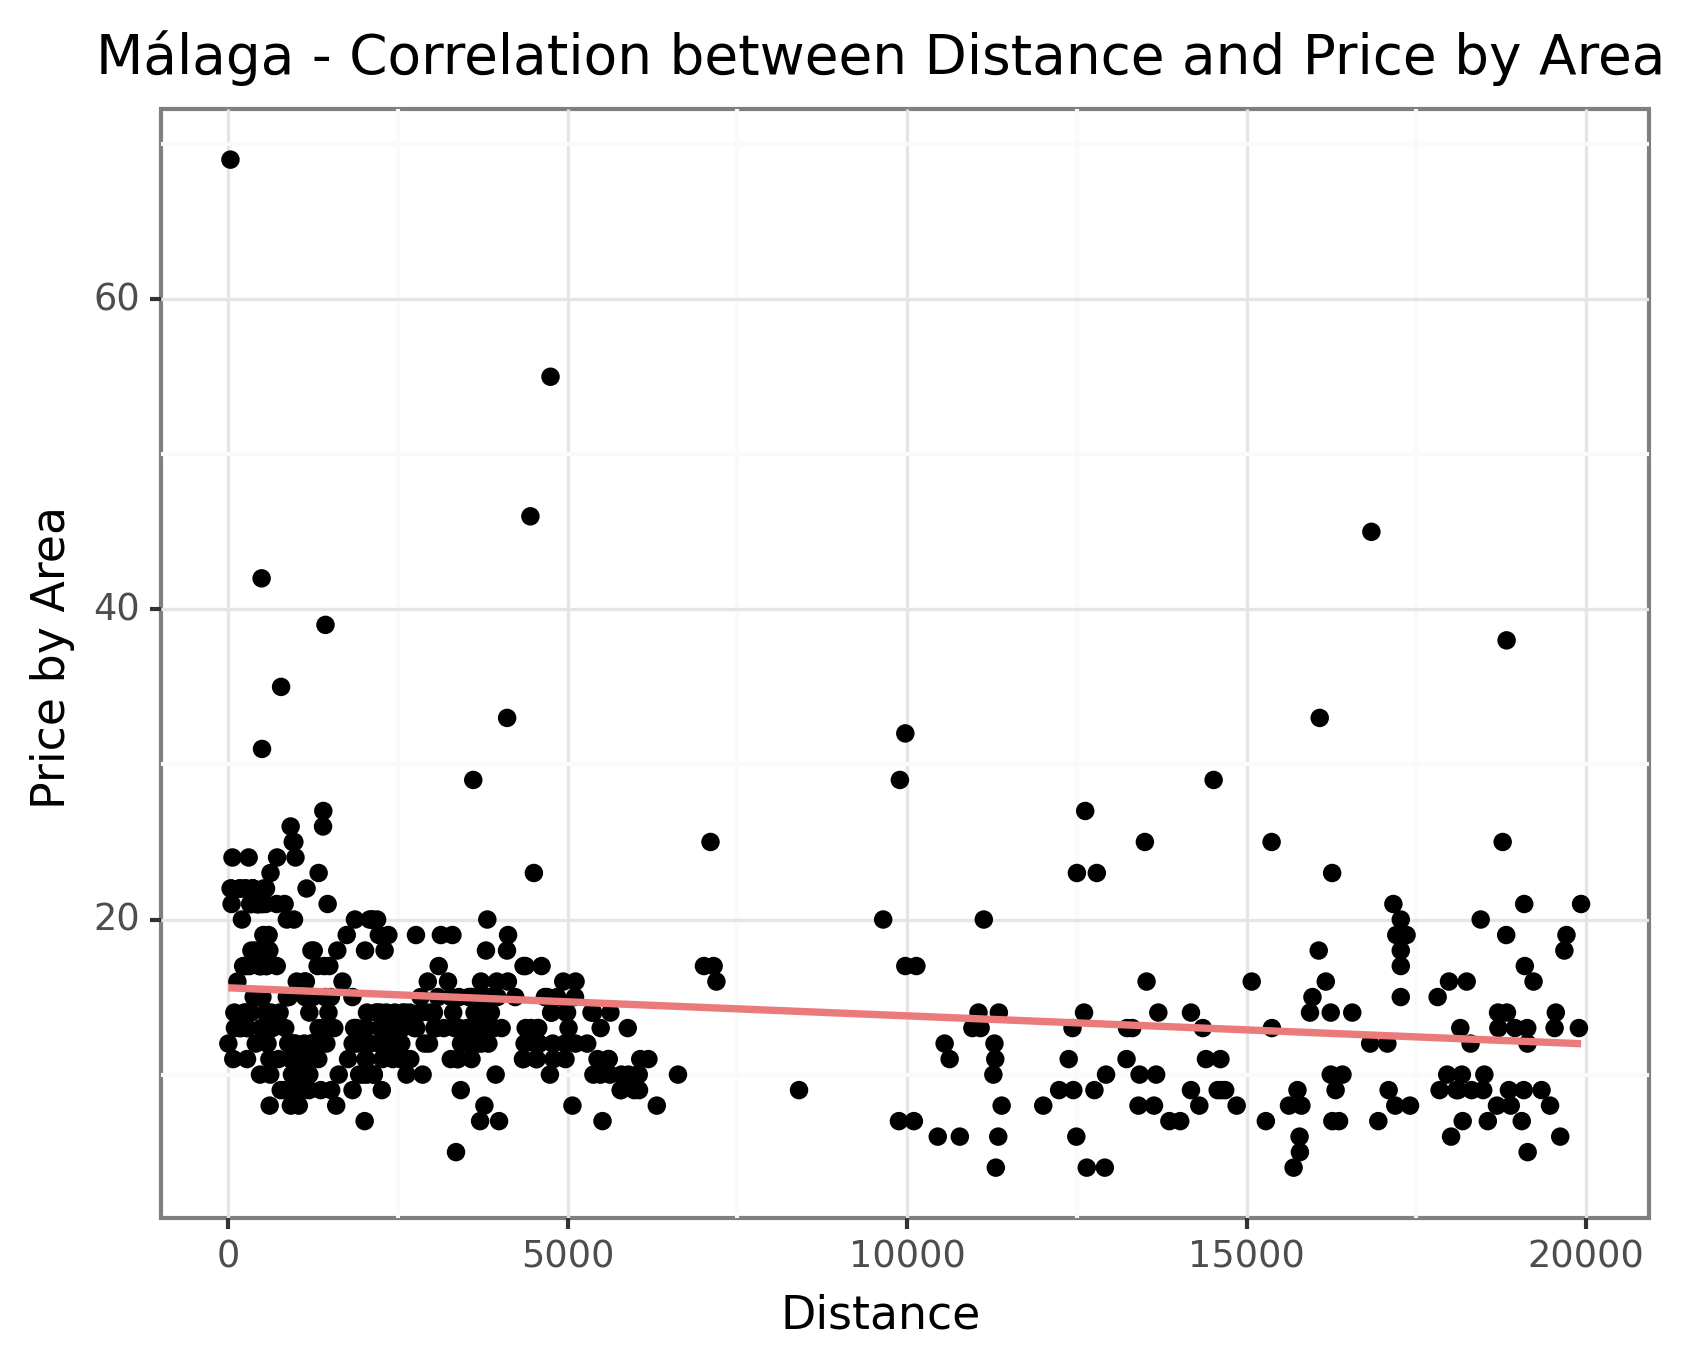
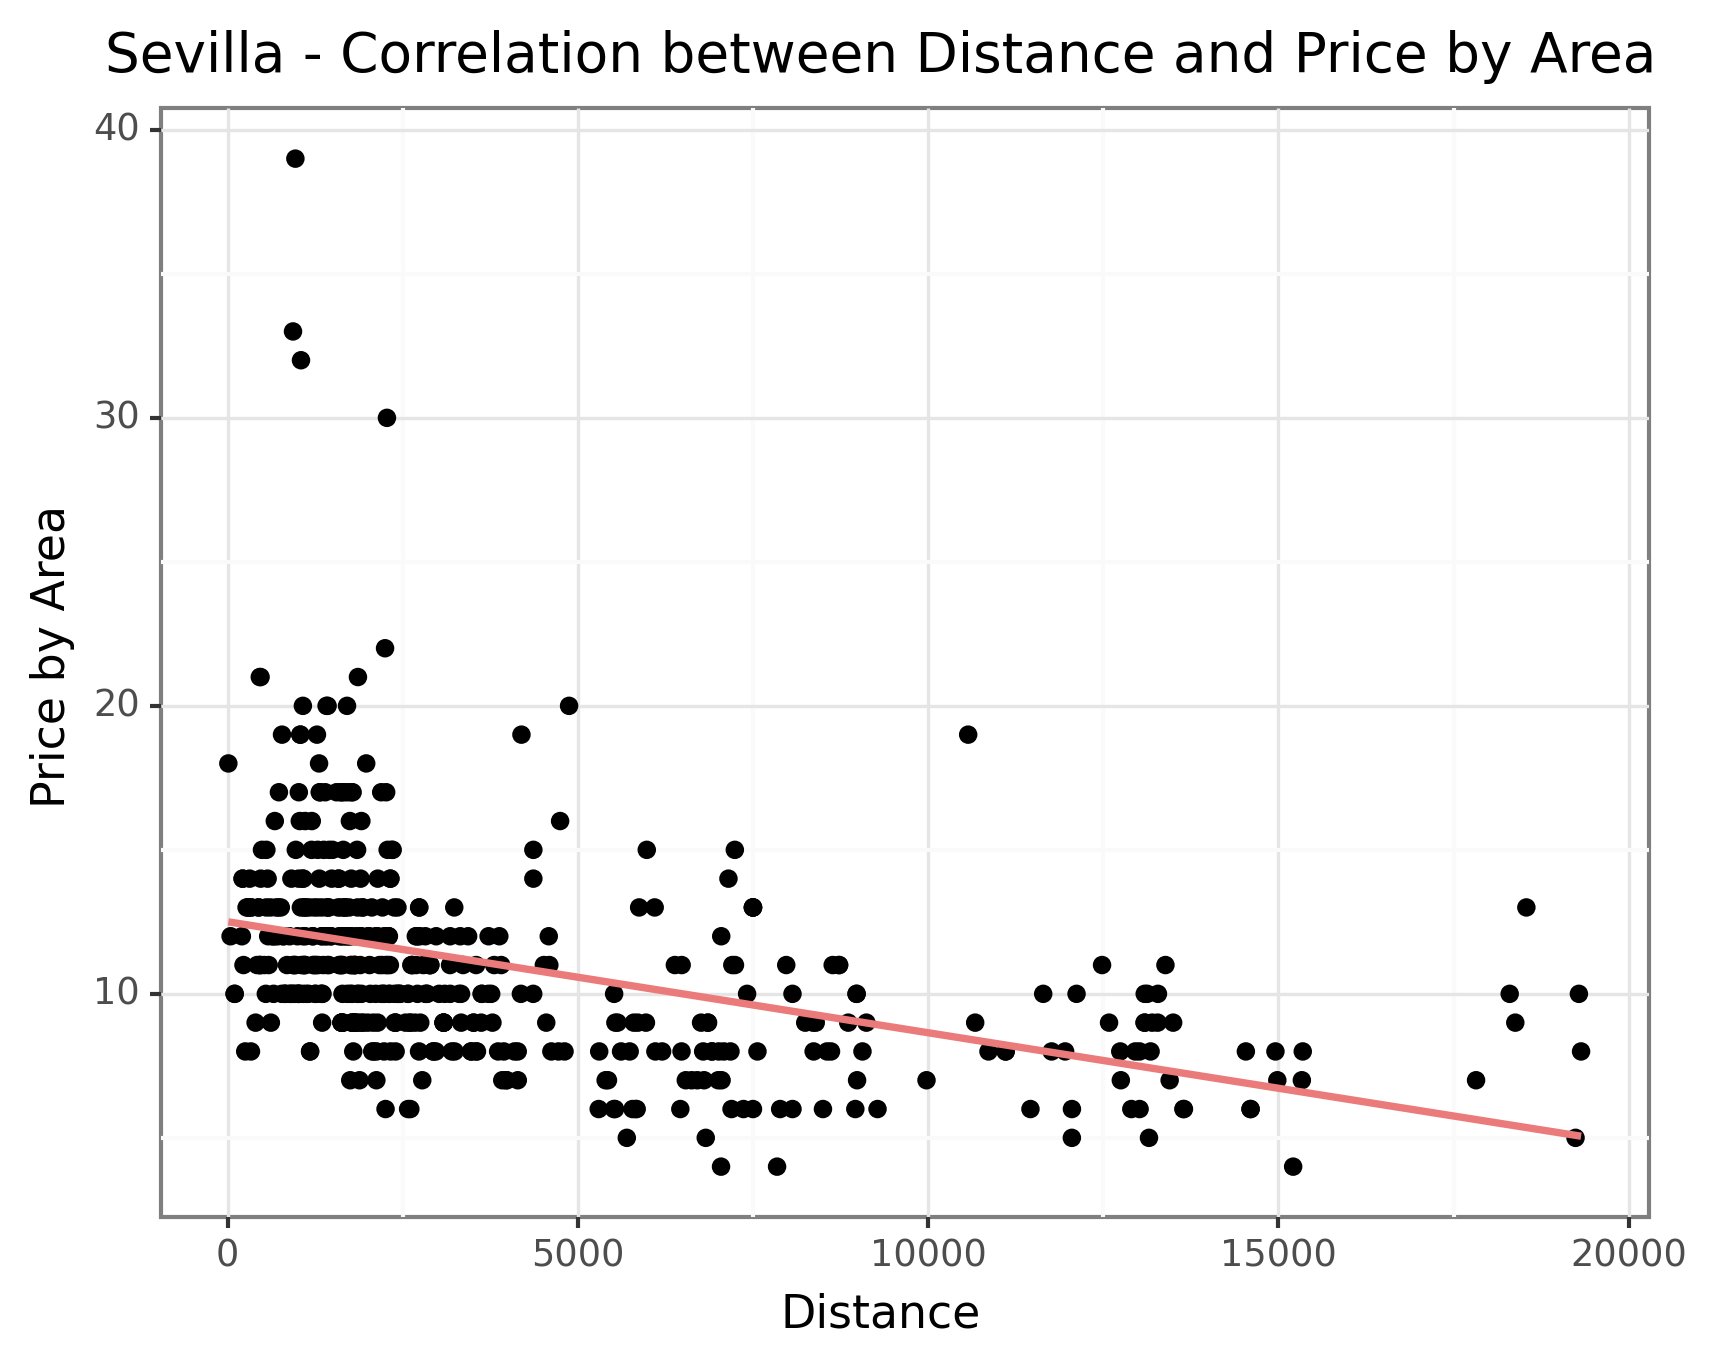
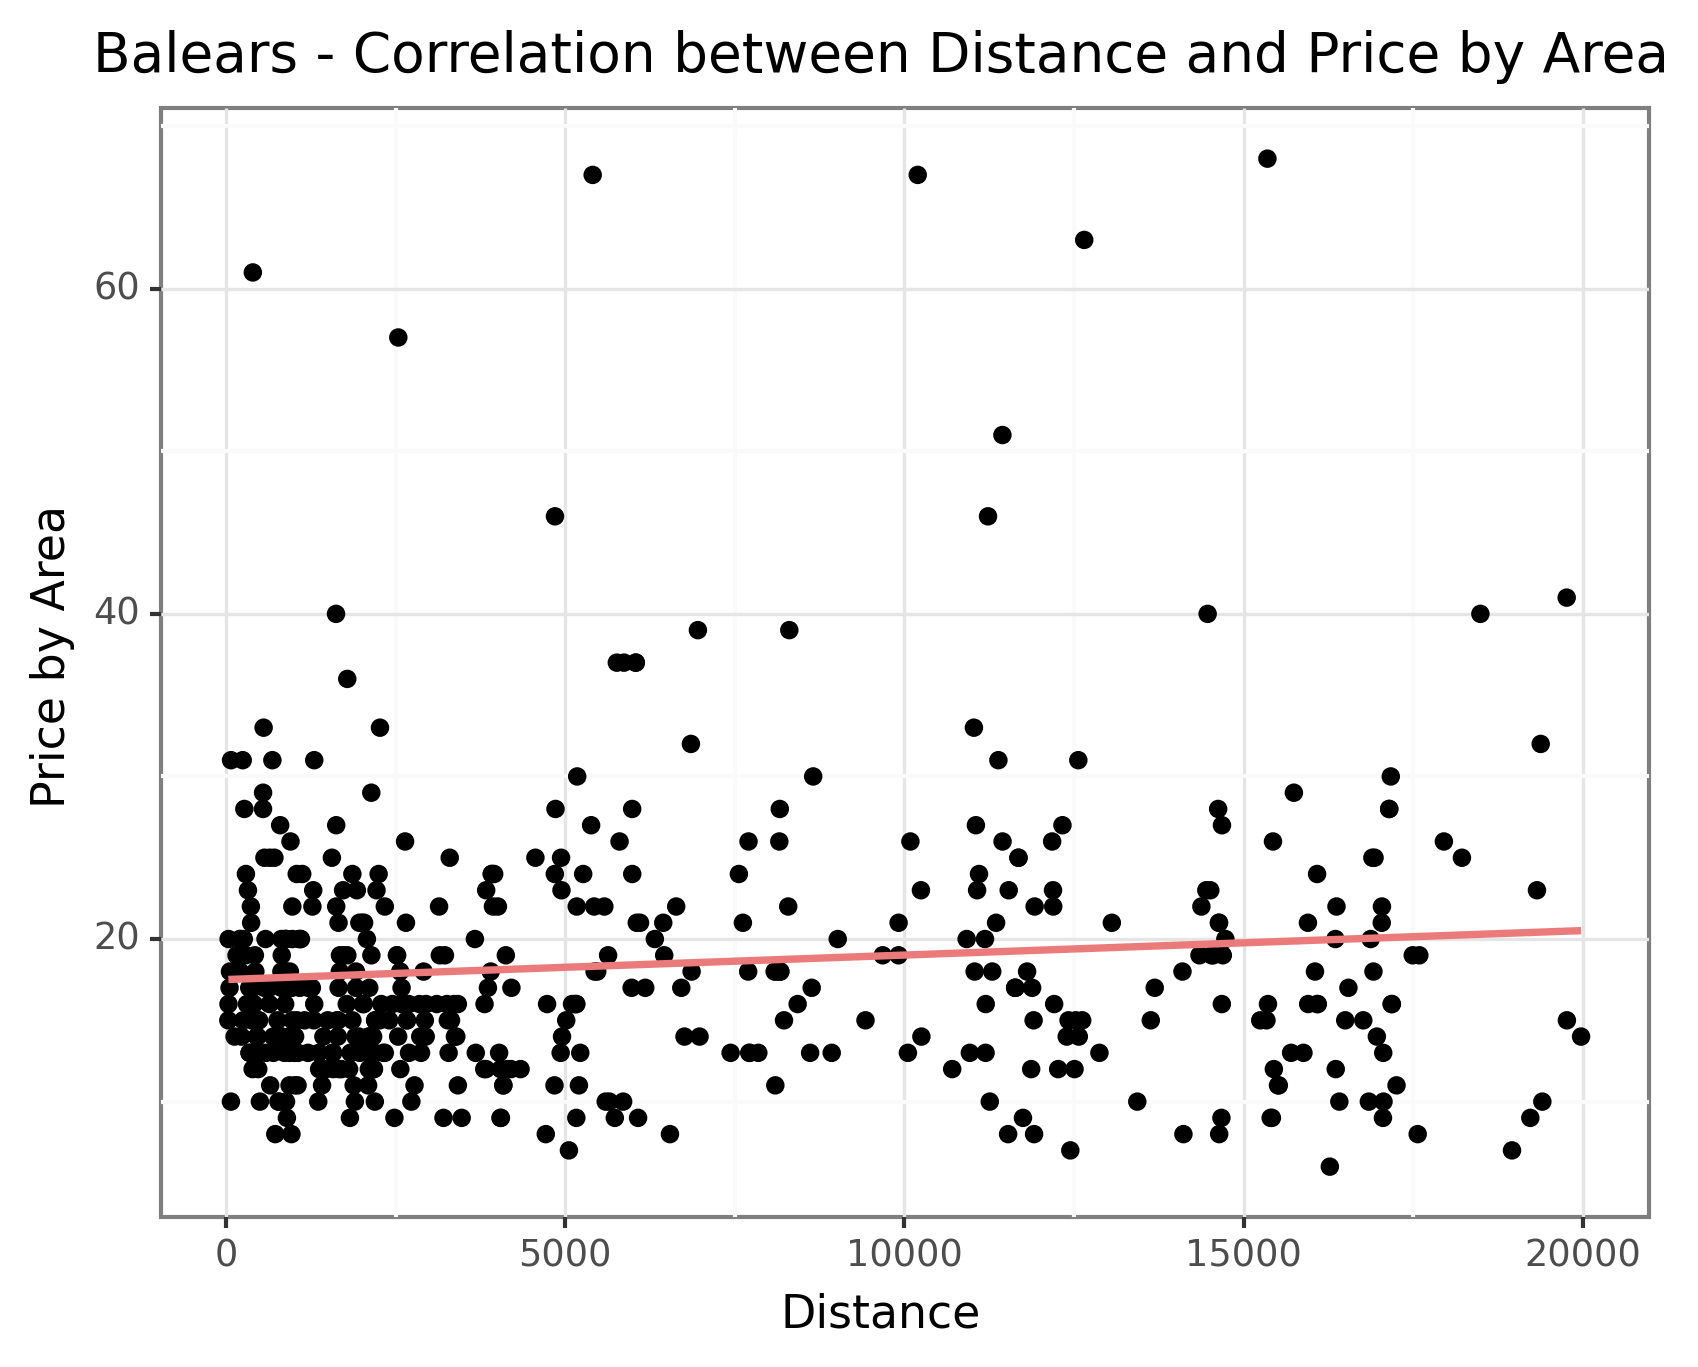
However, Balears (Palma) stands out as an exception as seen in the the below graph. The rental properties in Palma display a slightly positive correlation between distance and price. This anomaly could be attributed to the fact that the Balears comprise of many islands, resulting in less developed infrastructure in the city center which causes a lower correlation. Another possible reason could be the unique demand dynamics in Balears. Being a popular tourist destination, the demand for residential properties in Palma might be influenced by factors such as proximity to beaches, amenities, and tourist attractions rather than solely based on distance from the city center. This distinctive demand pattern could lead to a different price relationship compared to other cities where distance from the city center plays a more prominent role. However, without more detailed information, we are unable to draw any definitive conclusions about the data in Palma. Nevertheless, this insight provides valuable information for understanding the pricing dynamics across different cities, emphasizing the influence of population density and geographical factors on residential property prices.
📝 Other Factors
Economic Factors
This analysis examines the correlation between rental prices and the movements of the economic factors by using Gross Domestic Product (GDP). By studying the relationship between rental prices and economic indicators, such as GDP, it helps uncover potential links between the real estate market and the overall economic performance of the country.
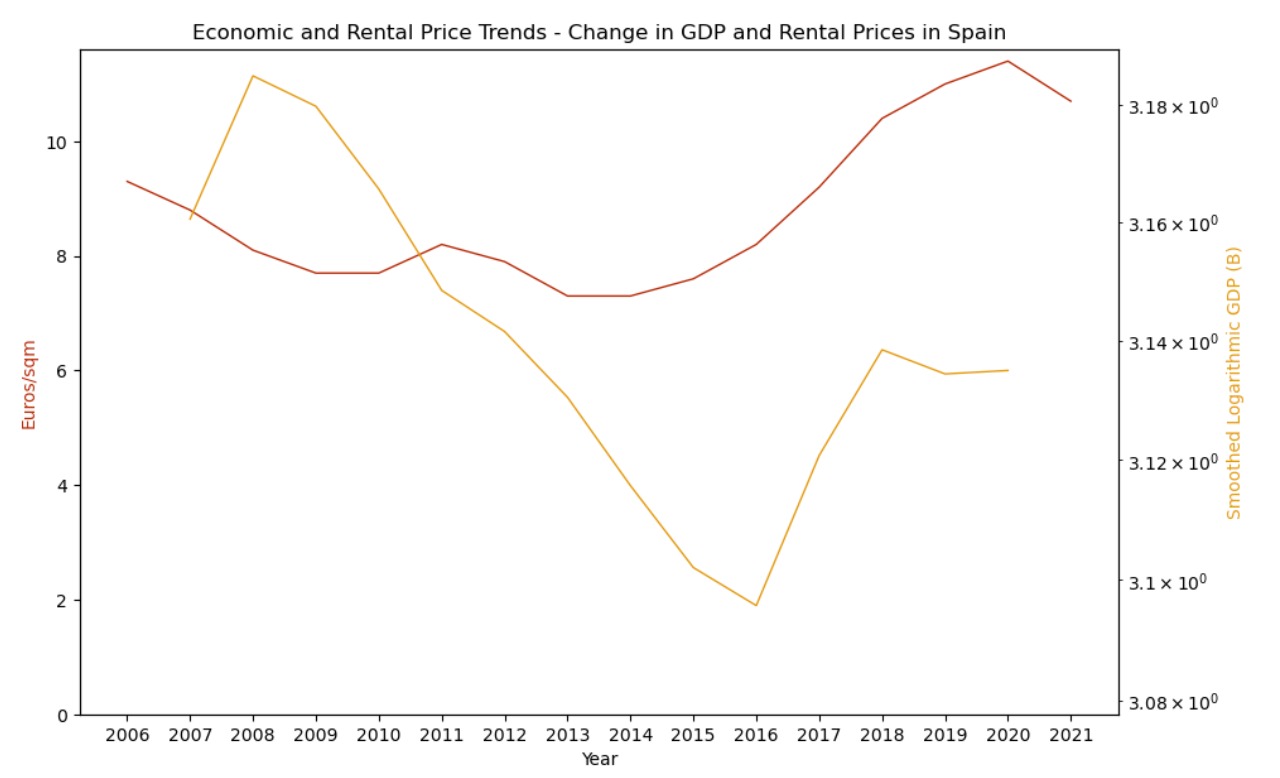
The presented graph illustrates the relationship between Spain's rental prices and its economic fluctuations from 2006 to 2021. Notably, there is a noticeable correlation between rental prices and the country's GDP, indicating that rental prices tend to follow the trajectory of the overall economy. This can be observed by the significant rebound in GDP aligning with the upward trend of rental prices.
However, compared to other natural economic cycles like recoveries, rental prices in Spain appear to be less responsive to economic shocks. The period from 2008 to 2011, which experienced a significant shock in GDP likely due to the ripple effect of the 2008 macro-environmental events, had a minimal impact on rental prices in the country. This phenomenon can be attributed to the sticky downward effect of necessities, including rent. Owners are less inclined to reduce prices for recurring payments due to factors such as the loss of bargaining power for future prices and loss aversion.Overall, this analysis suggests that rental prices in Spain exhibit a somewhat delayed response to economic shocks, potentially influenced by factors related to the nature of essential expenses and psychological considerations of property owners.
Demographic Factors
This analysis investigates the correlation between rental prices and population density. Understanding the relationship between rental prices and population density can shed light on the housing demand and supply dynamics in densely populated areas, providing insights into market competitiveness and potential investment prospects.
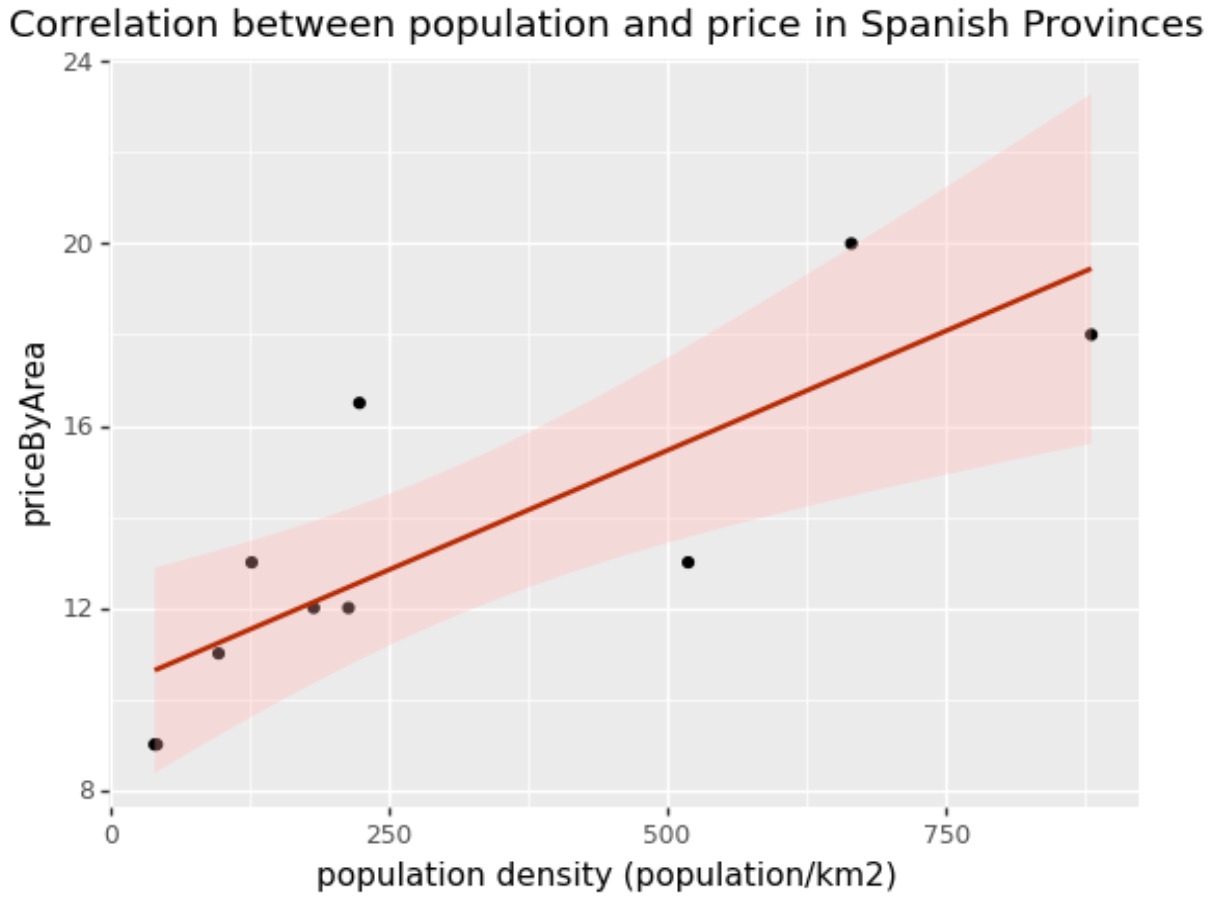
The graph demonstrates a strong positive correlation between price and population density, as indicated by the steep line of best fit. Notably, 7 out of the 10 cities fall within the 95% confidence interval (red shaded area), suggesting a significant relationship between price by area and population density. Thus, it can be concluded that there is a positive association between real estate prices and population density.
The positive correlation between real estate prices and population density can be attributed to several key factors. Densely populated areas are desirable due to access to amenities, services, and employment opportunities, leading to increased competition among buyers and renters. Additionally, densely populated areas tend to offer a wide range of amenities, services, and job opportunities, making them desirable places to live. This desirability leads to increased competition among buyers and renters, further influencing price levels. Moreover, areas with higher population density often exhibit higher economic activity and prosperity, which can contribute to increased property values. Overall, the positive relationship between real estate prices and population density reflects the complex interplay between supply, demand, amenities, and economic factors in the housing market.
📝 Sales Analysis
In addition to rental analysis, we also conducted sales analysis on properties in ten cities in Spain. We plotted price distribution graphs for all ten cities, with the distribution for Madrid below (for the other cities, please view our appendix).
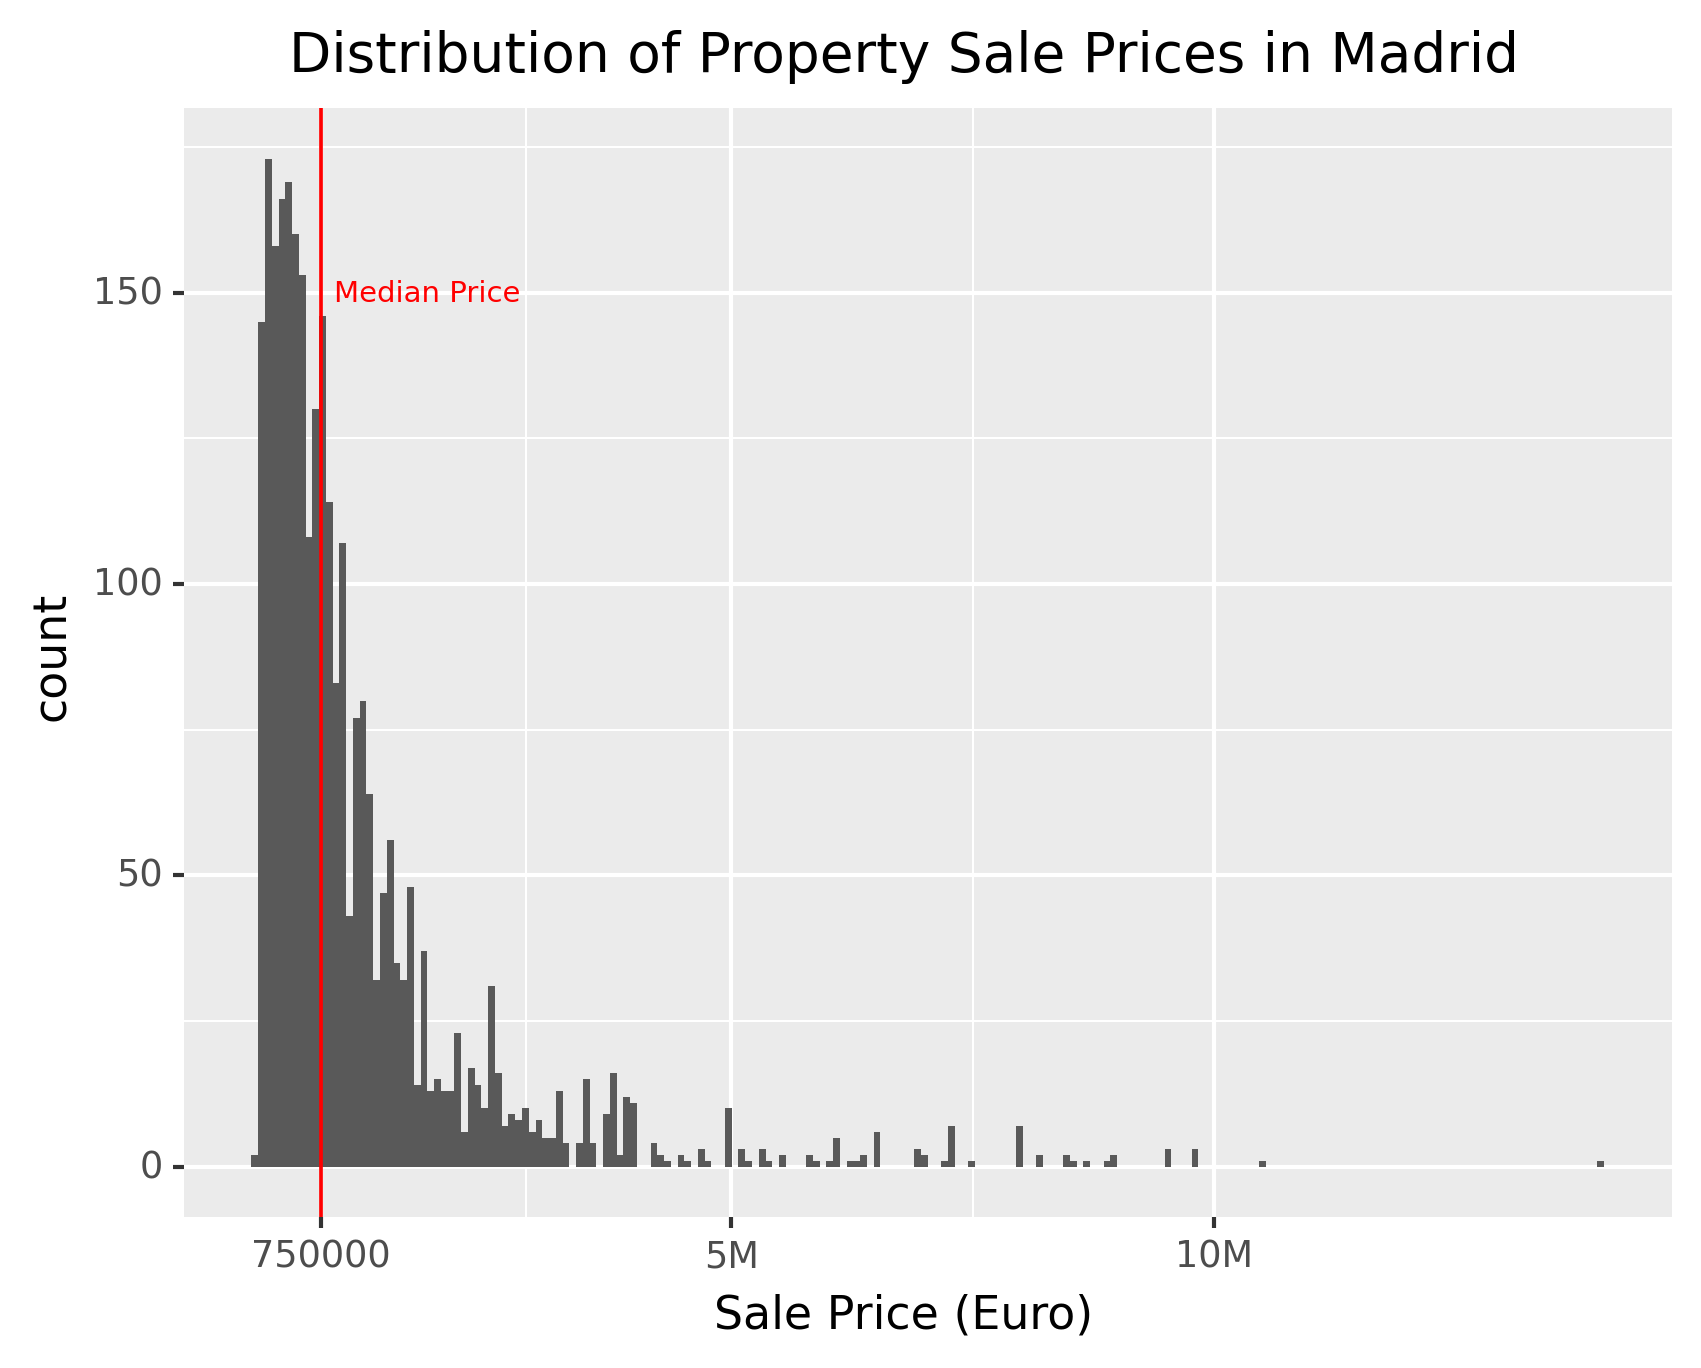
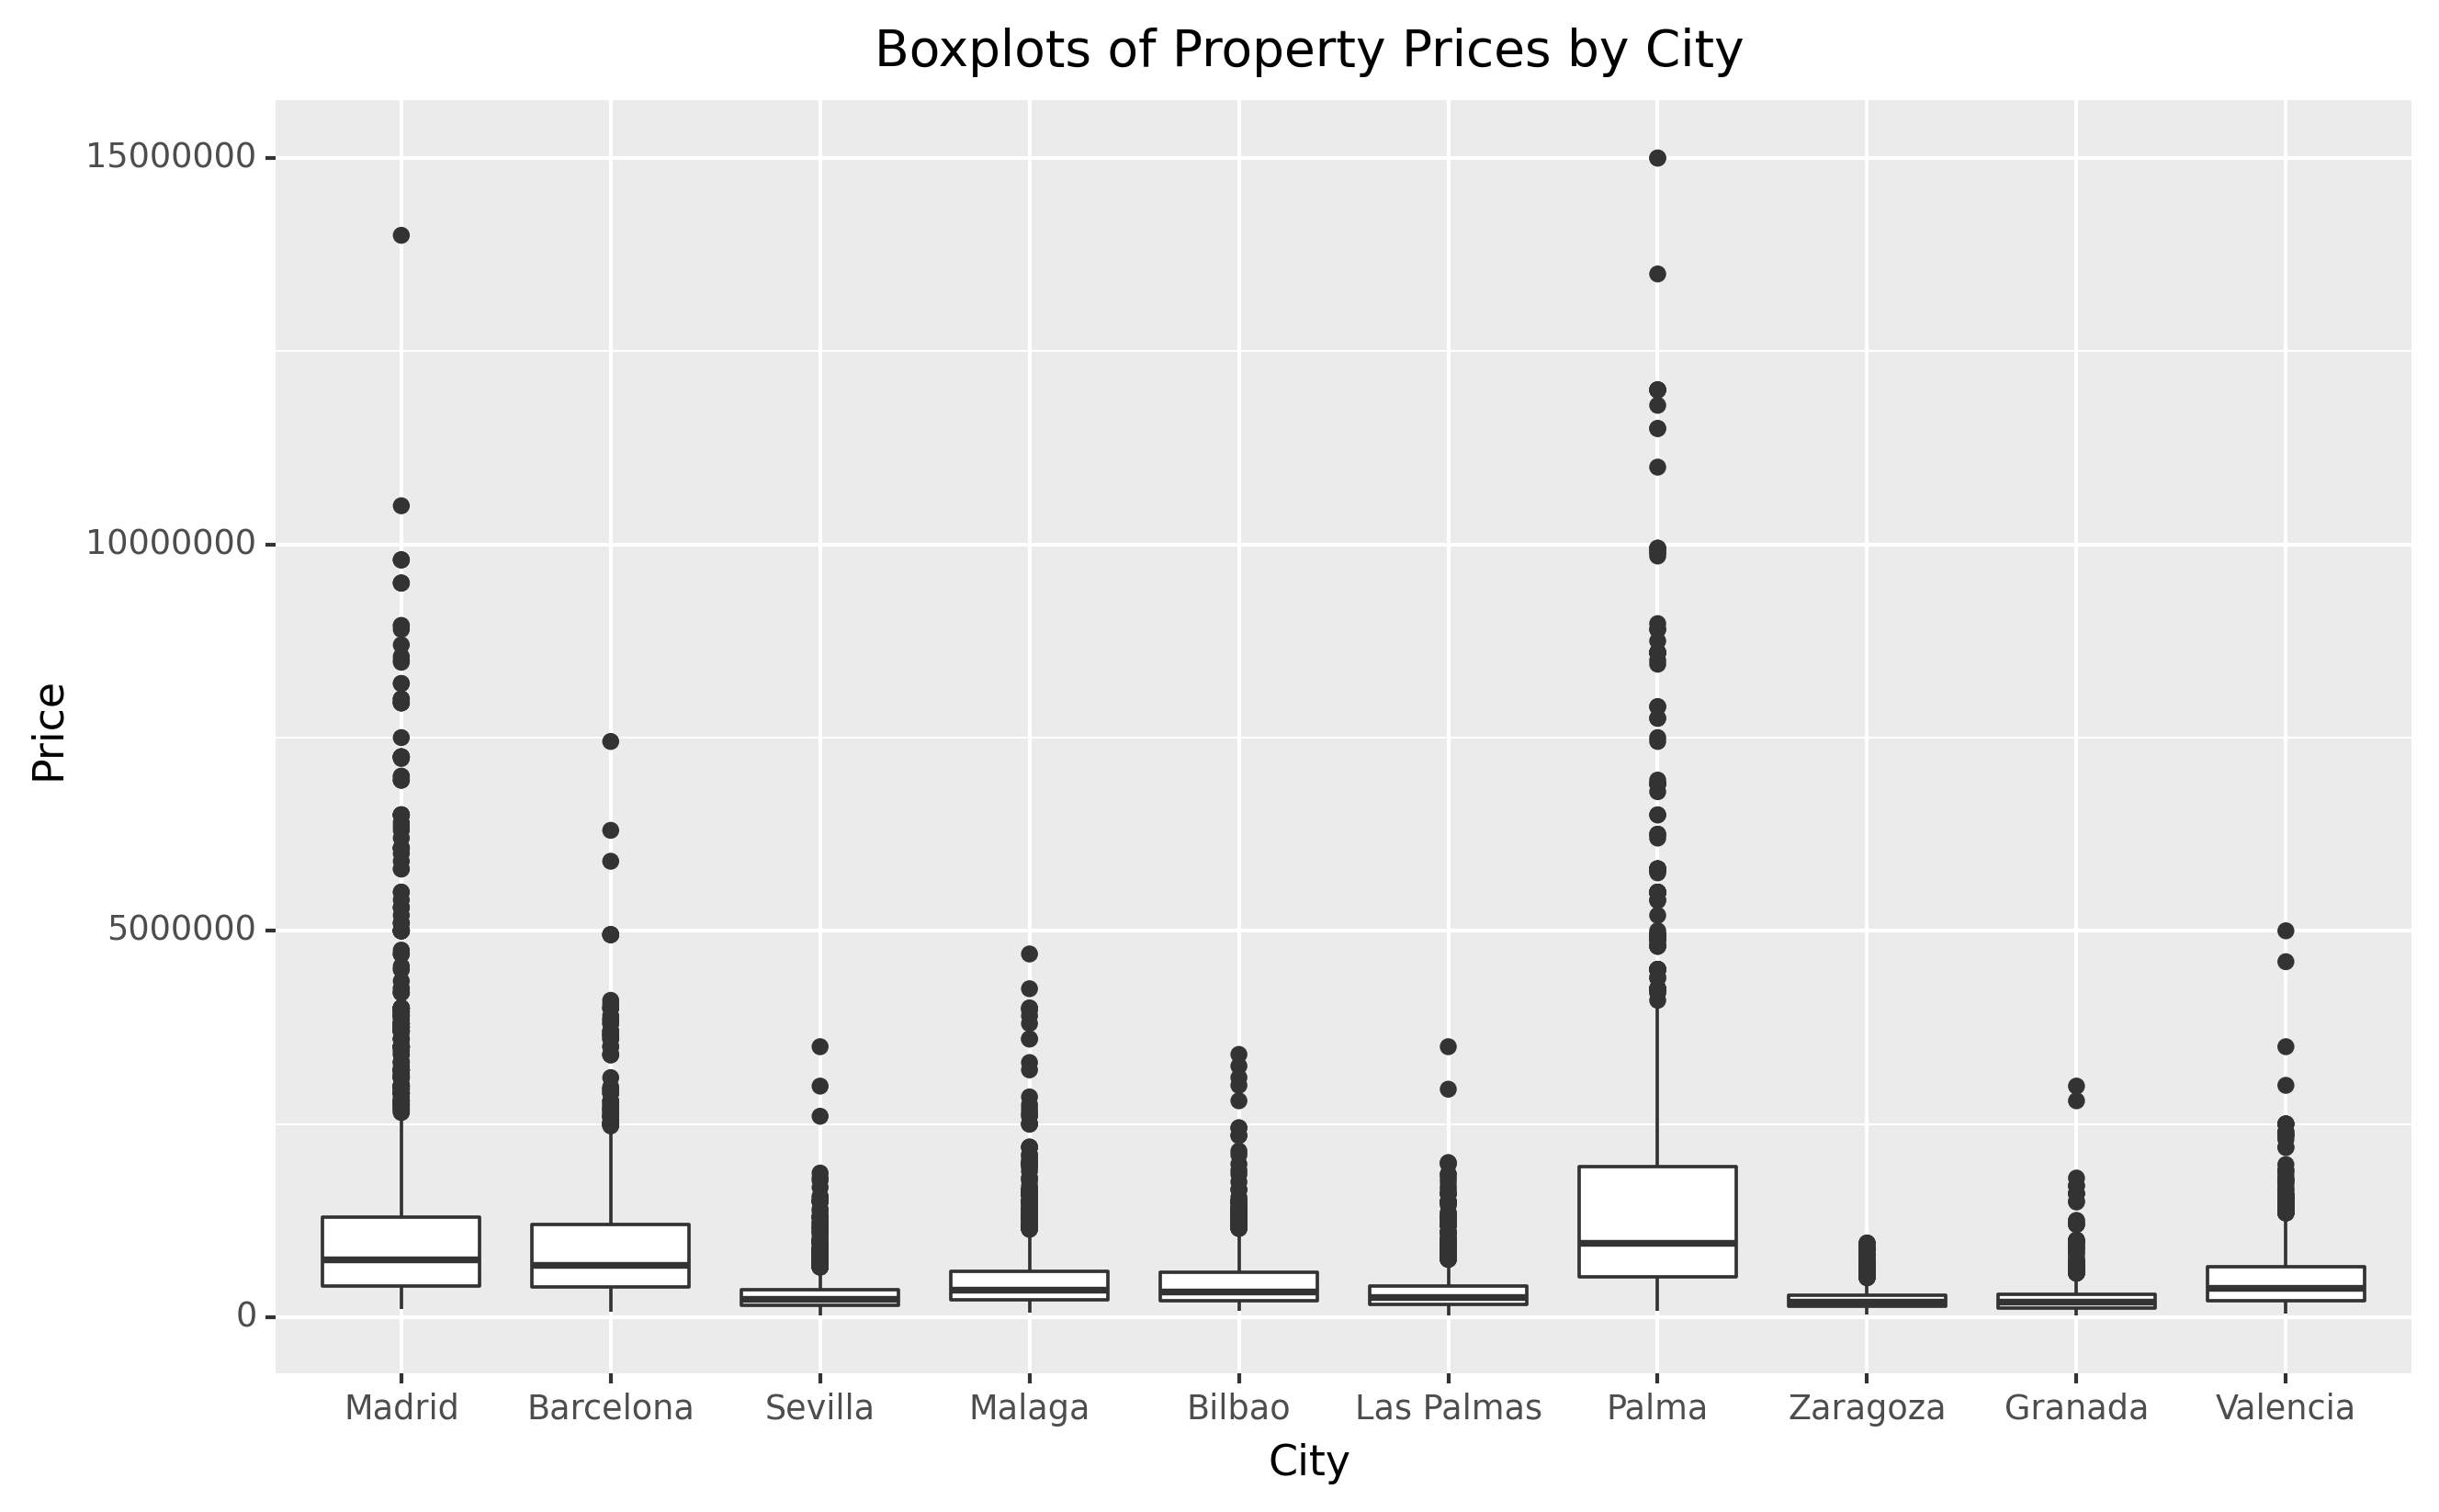
The graph shows a positively skewed graph, with a significant majority of property sales prices in Madrid near the median price of 750000 Euros. The rest of the cities display similar trends, albeit with largely different median prices. When comparing the median prices of all ten cities, the resulting box plot looks like this:
📍 Property Heatmaps
District-level analysis of properties in Madrid and Barcelona
In this section, we focused only on properties within the districts of Madrid and Barcelona. According to government organisation, Madrid has 21 districts while Barcelona has 9 districts. We obtained the shapefiles from the muncipality websites of the cities, and ran a spatial join between the shapefile and the idealista datasets by utilising the Geopandas library. This was possible because each individual property listing on idealista provides exact longitude and latitude of the property. In total, we managed to produce four heat maps indicating the median price and median price by area for the districts in Barcelona and Madrid.
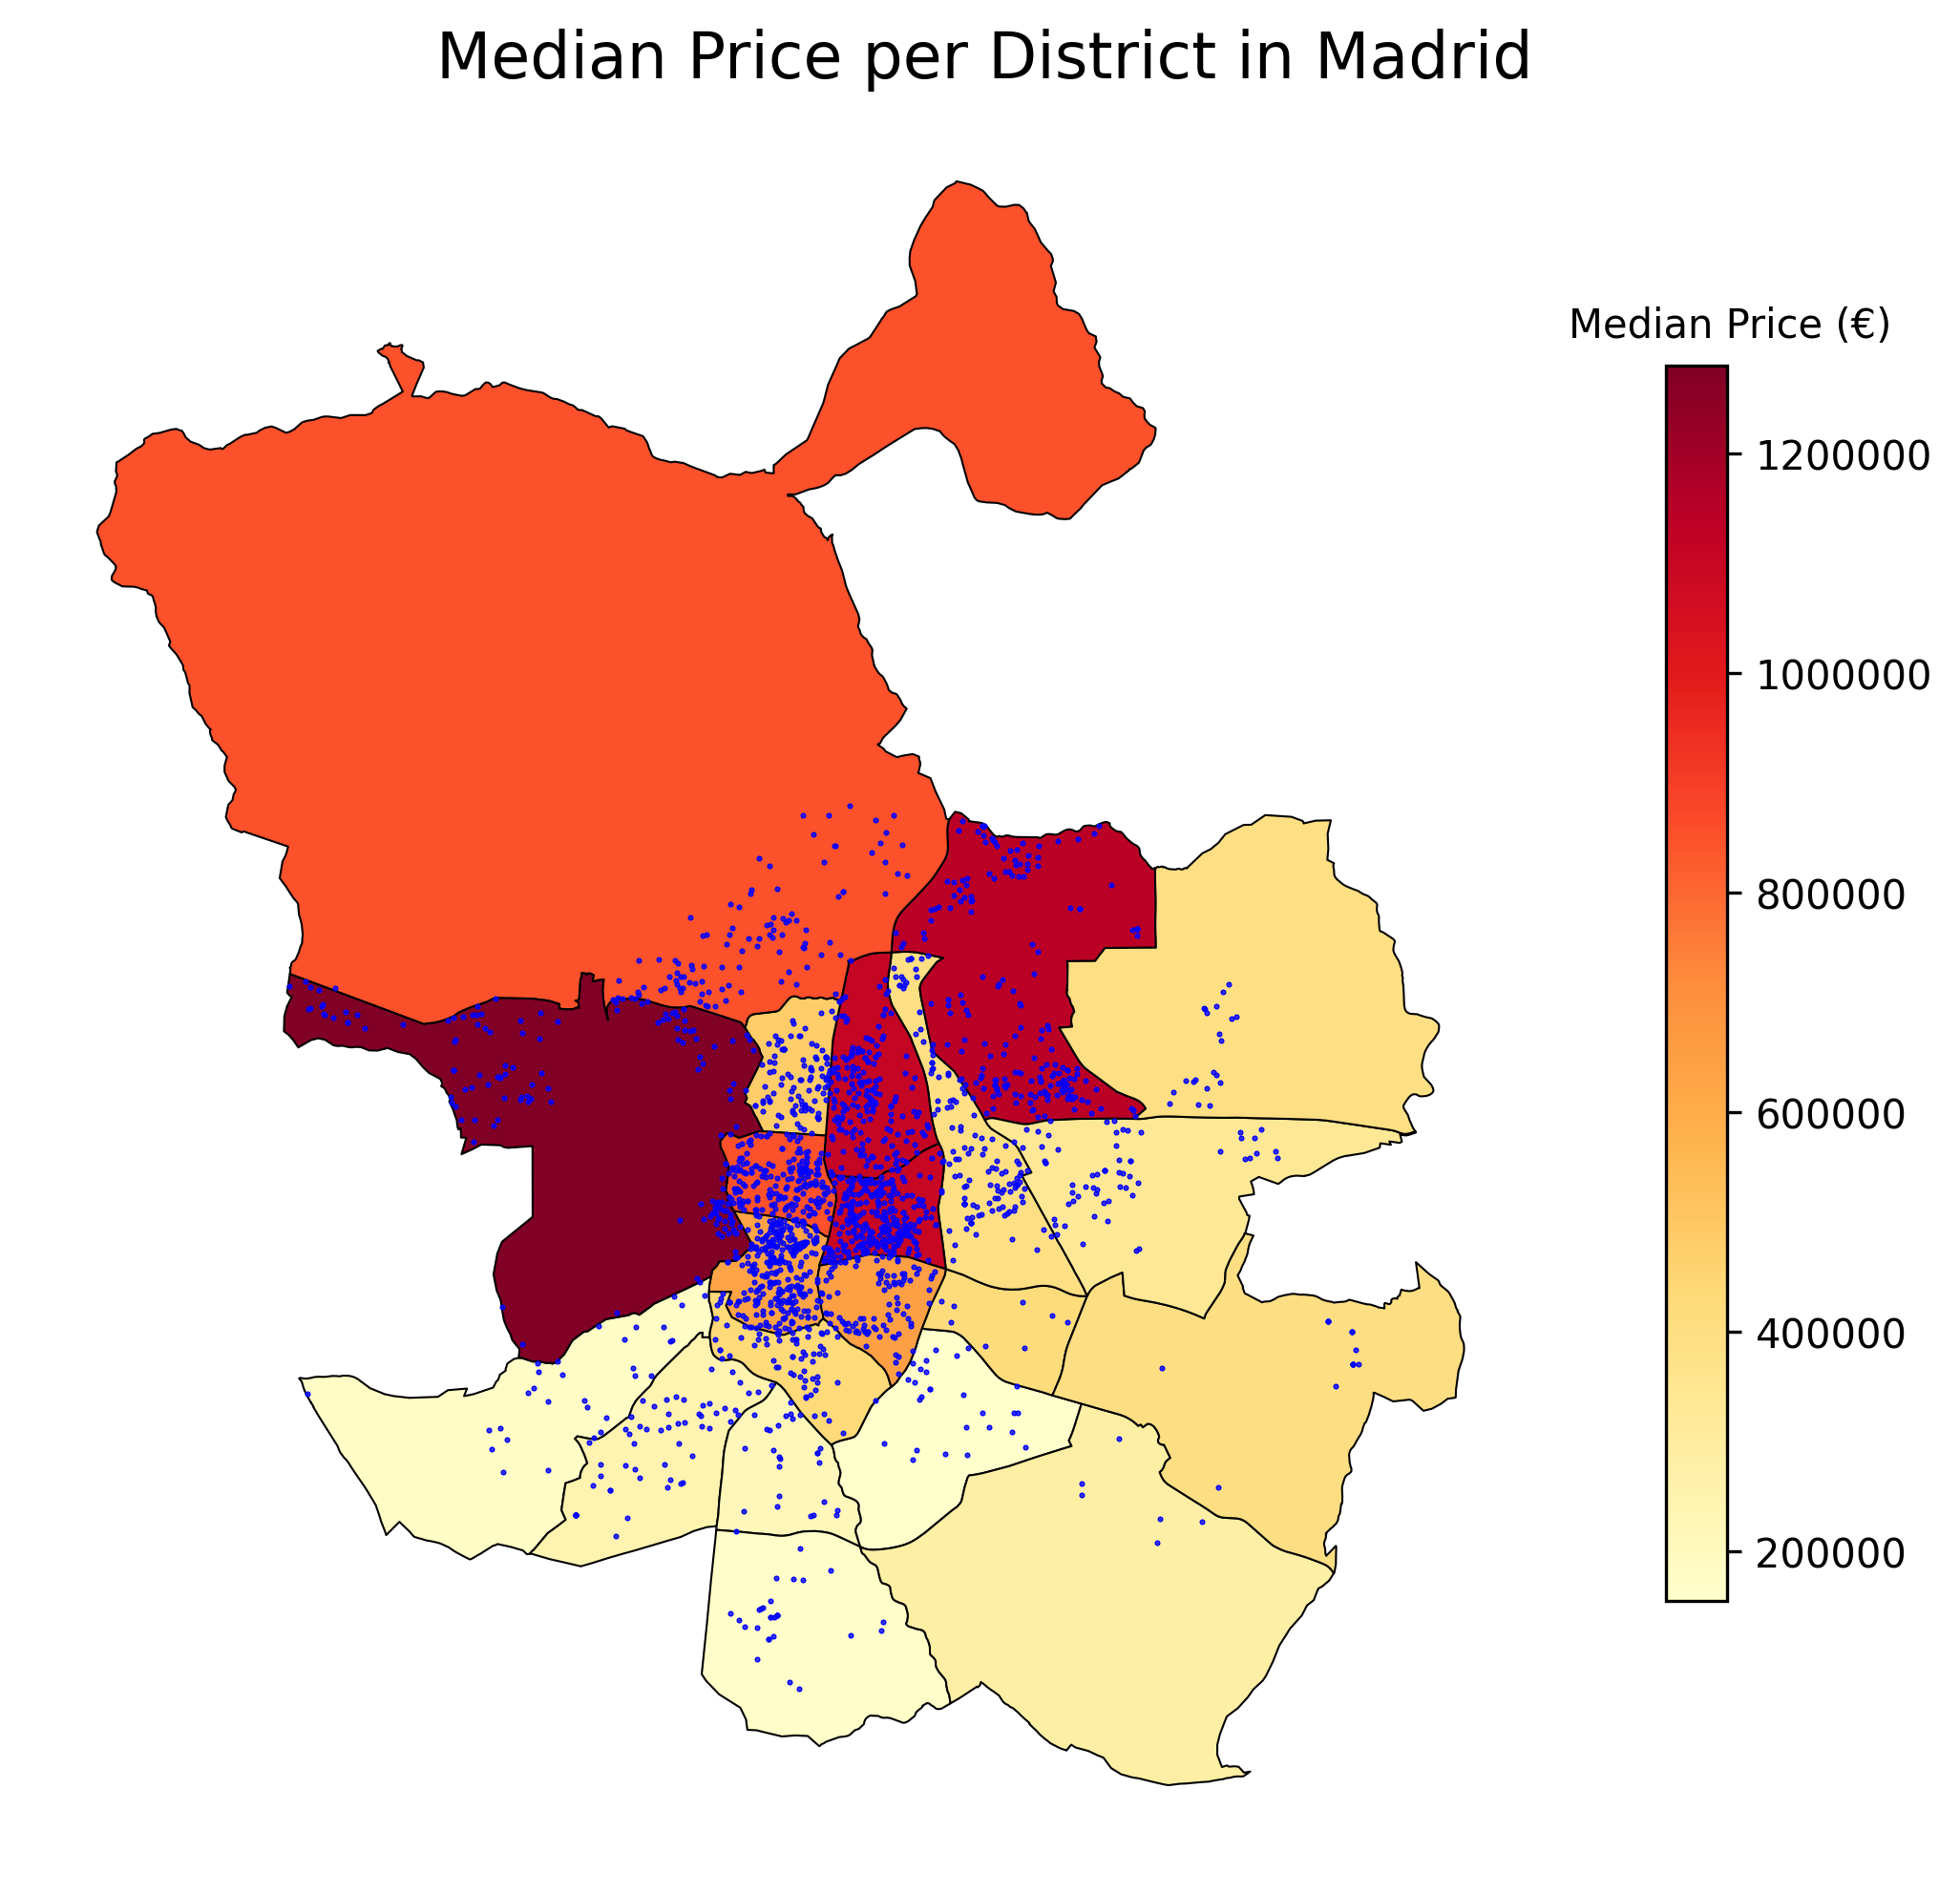
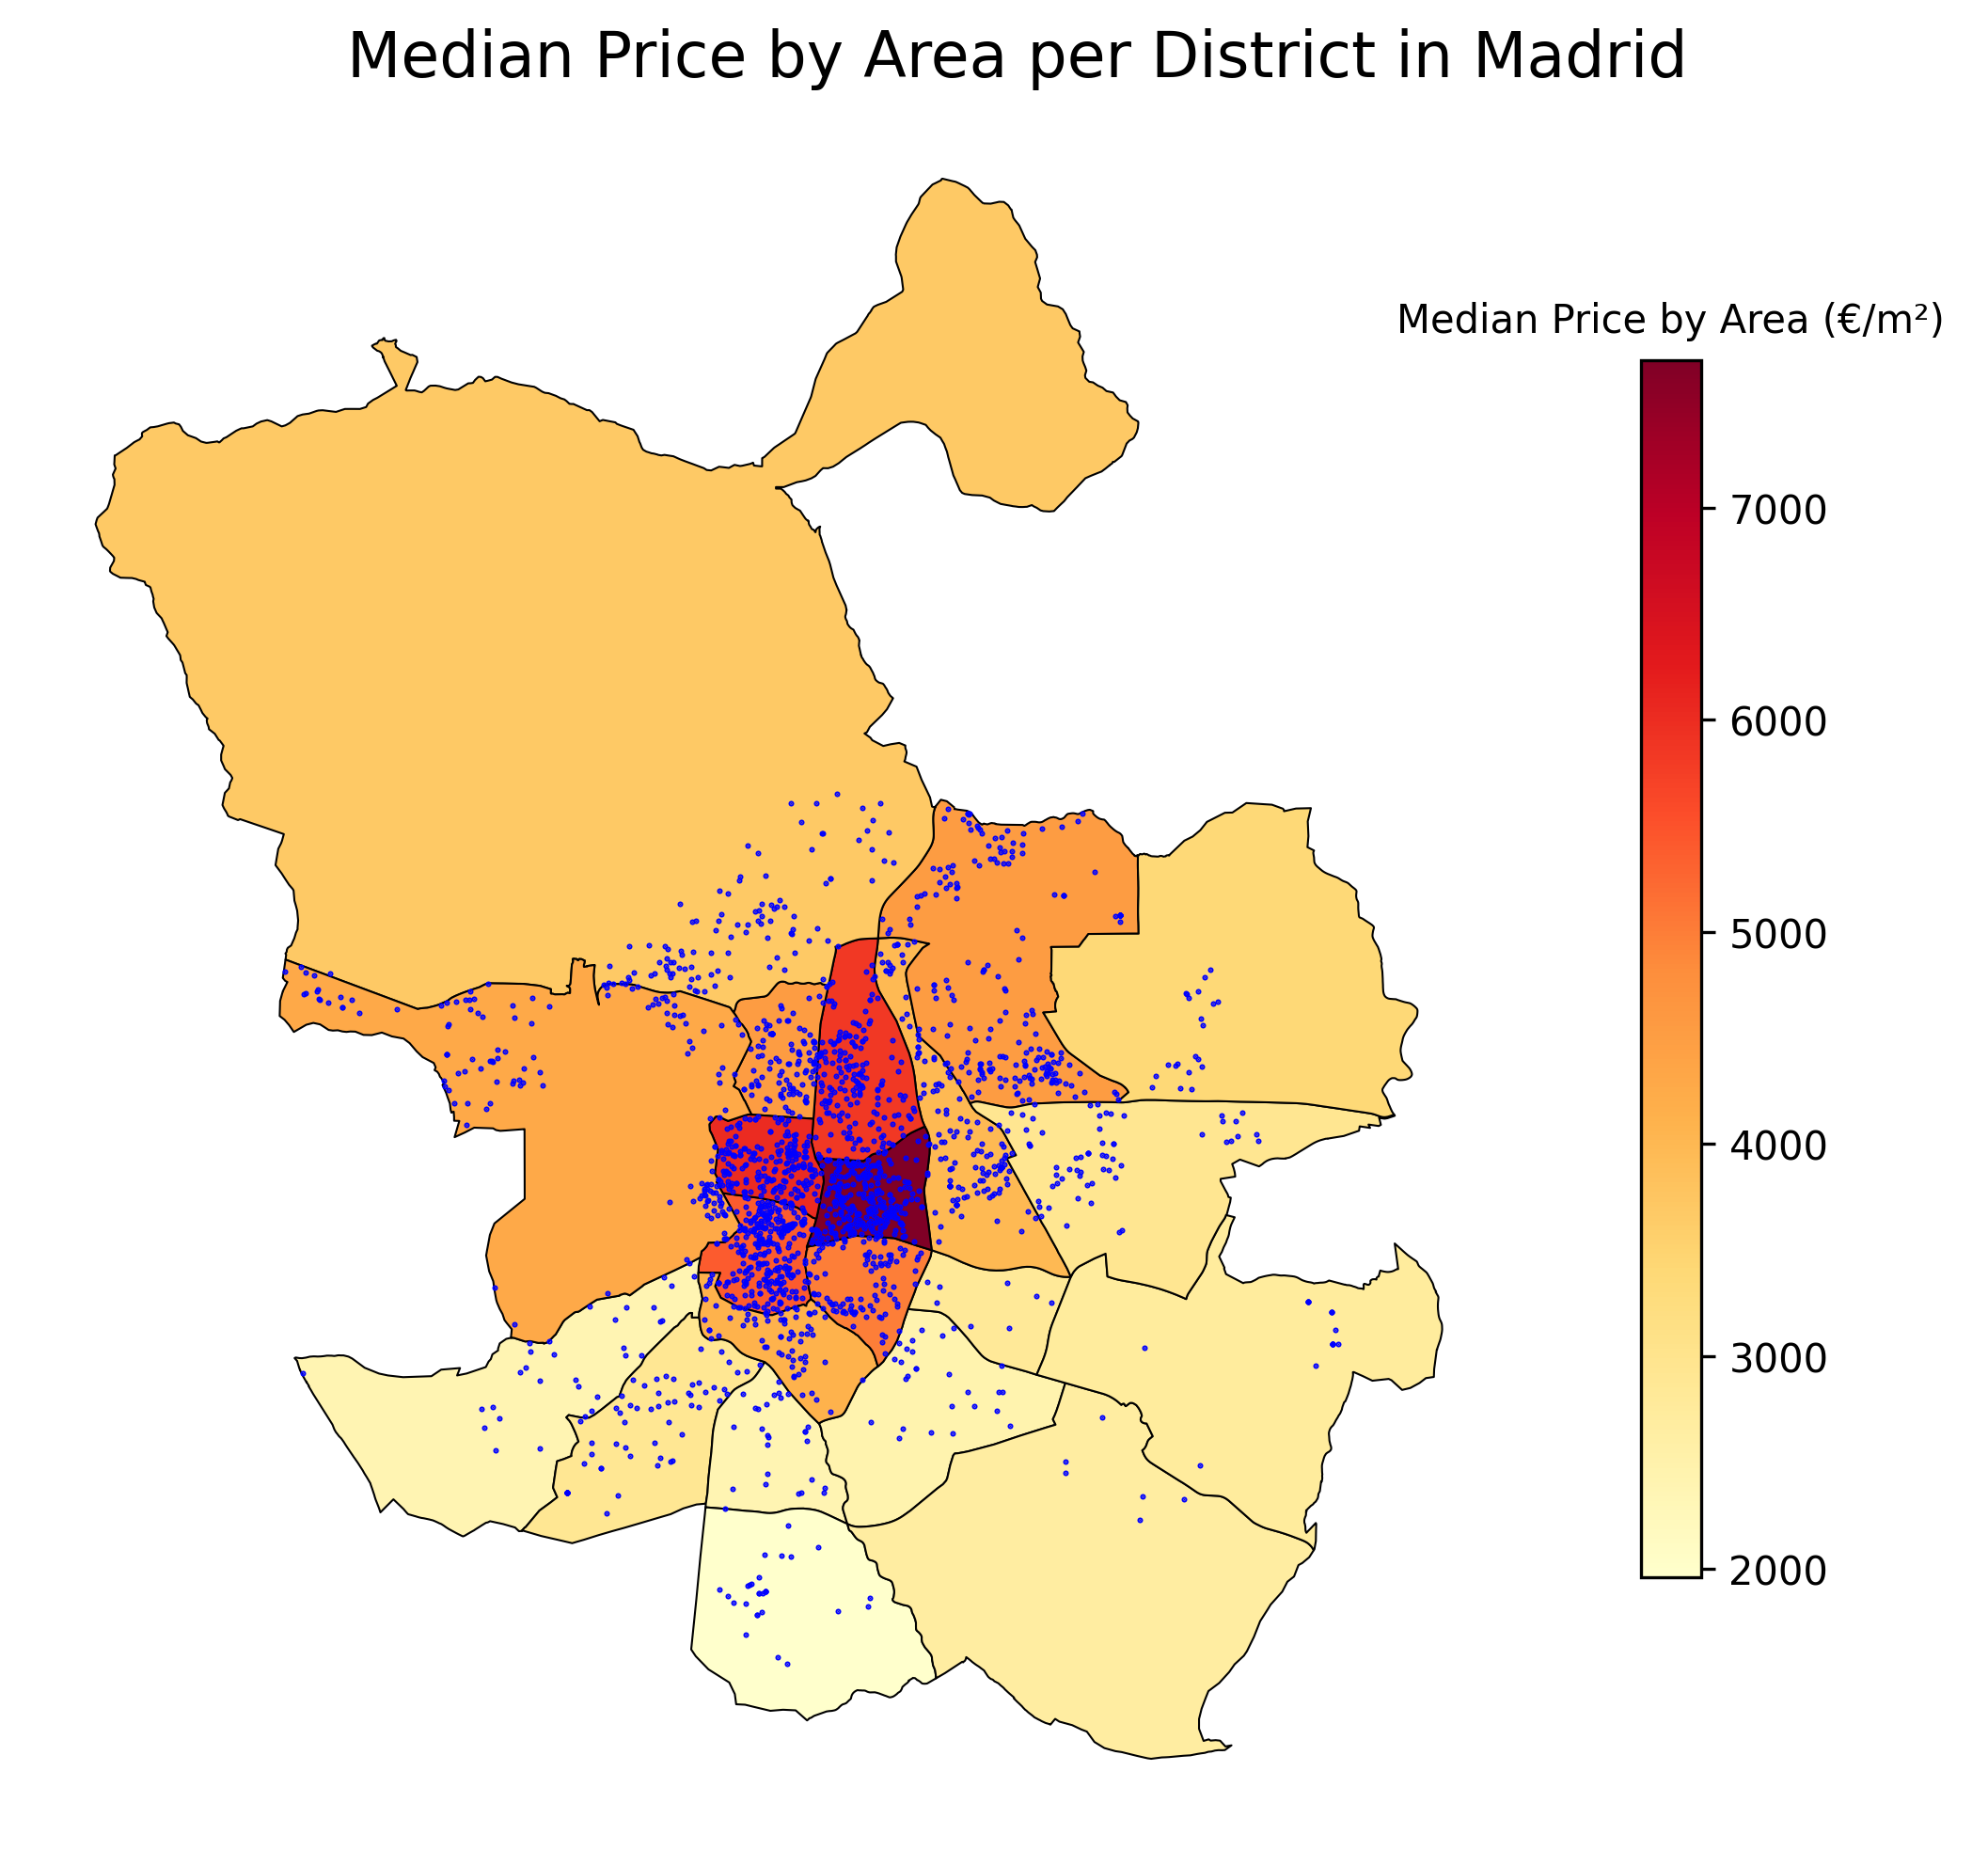
As seen in the diagrams above, there is a difference between actual price and price per square meter based on the districts of Madrid. The most reasonable explanation is that in highly urbanized areas in central Madrid, properties are smaller meaning they have a lower total price, as compared to larger estates in the suburbs and agricultural areas on the outskirts of Madrid. However, it is evident that property price per square meter is the highest in the center of the city. A similar story is painted for the districts in Barcelona:
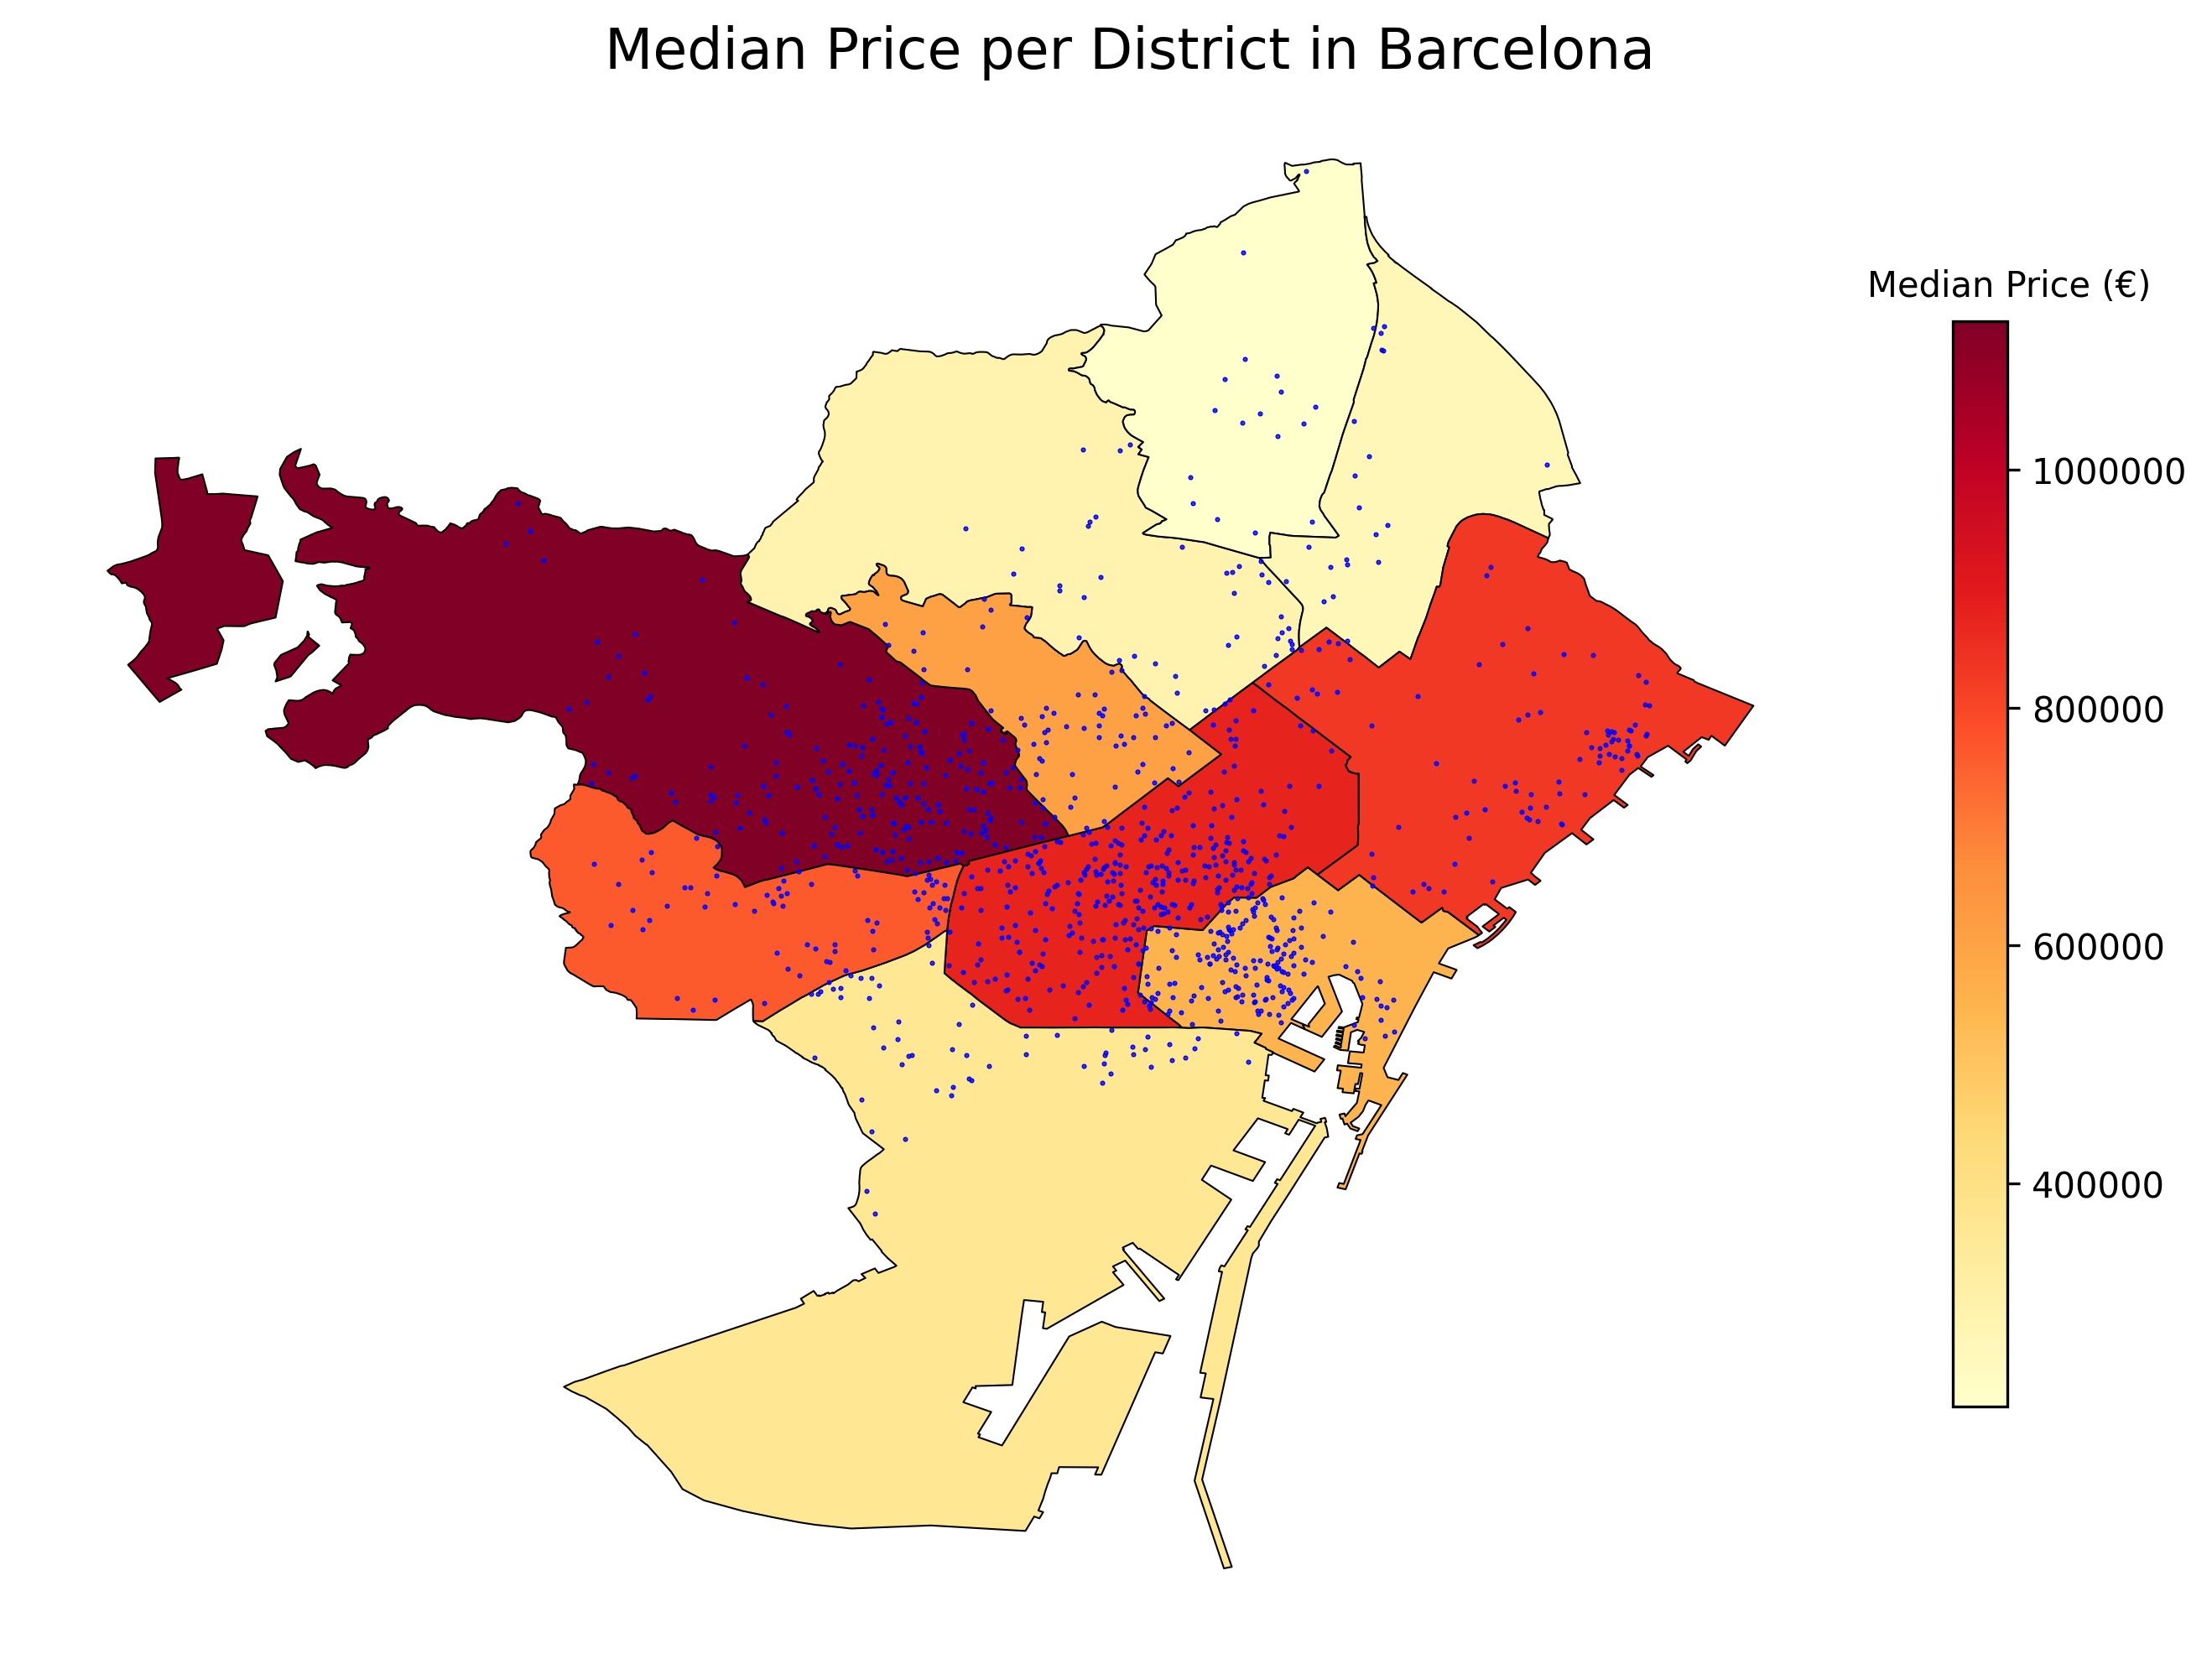
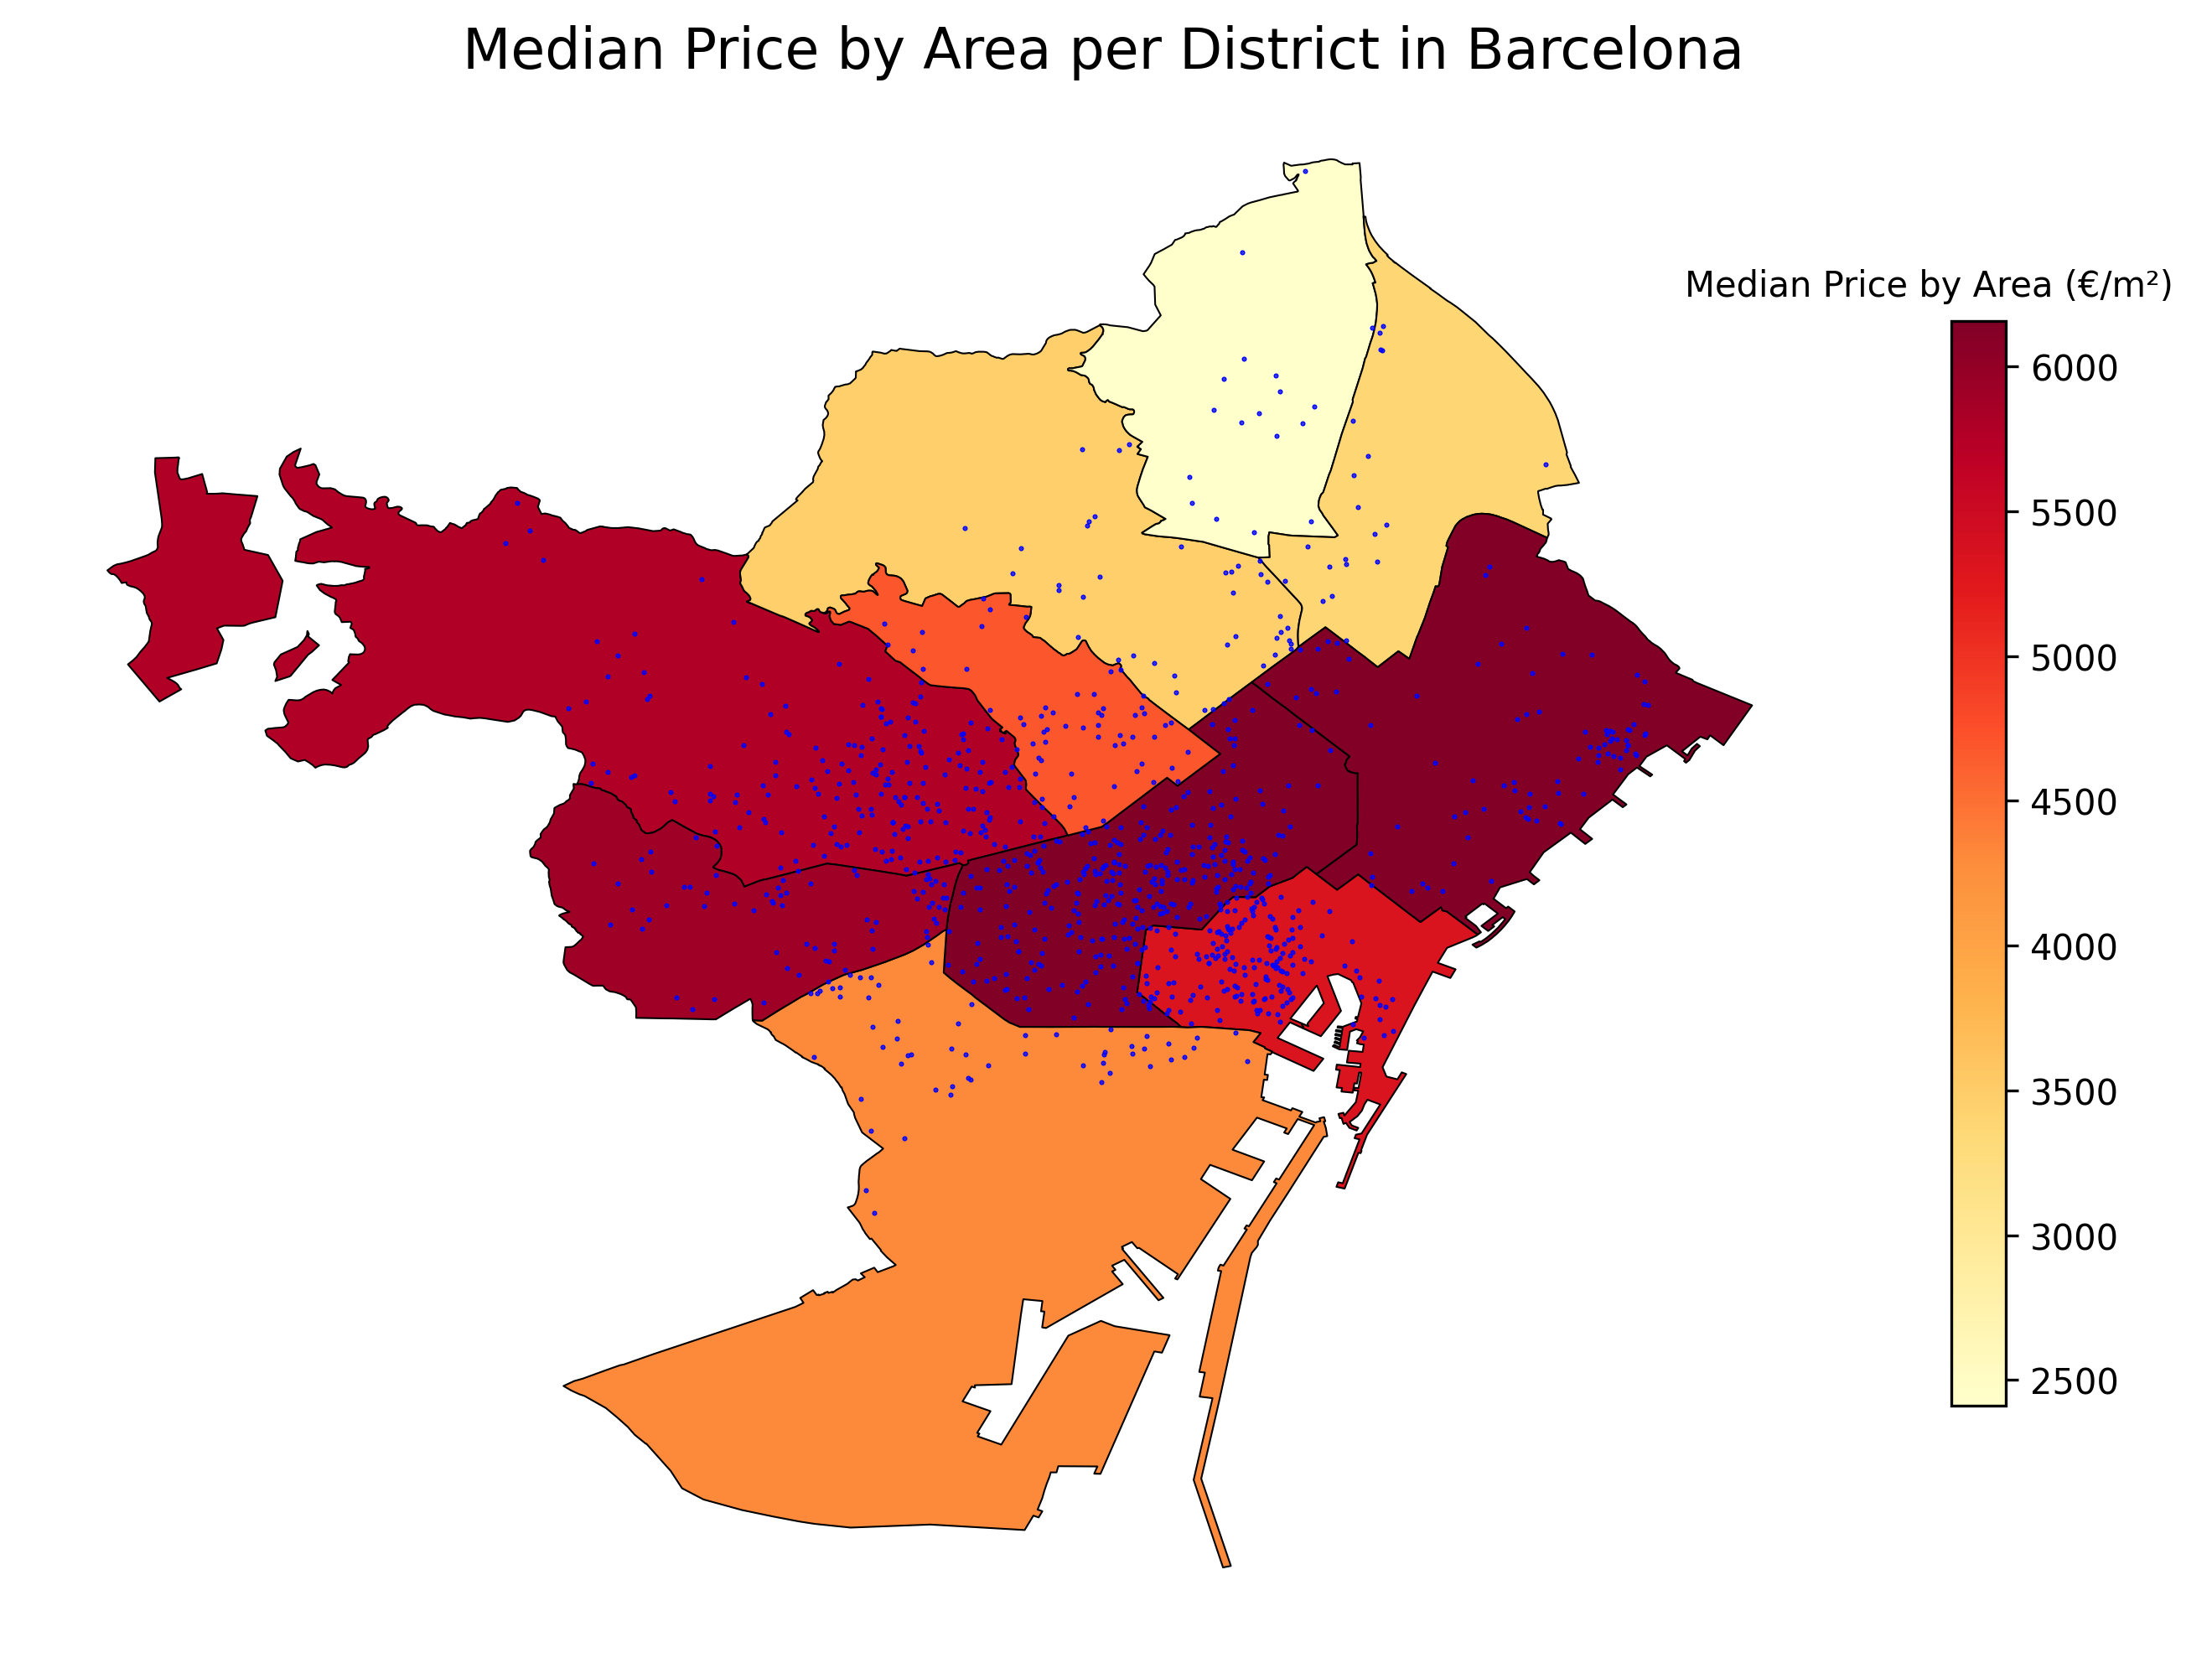
The heatmap of Barcelona shows a similar trend with high median price per area in the center. However, due to the geography of Barcelona, it is difficult to draw conclusions about the median price per district. Furthermore, there were a number of other challenges we encountered when coding the heat maps. For one, we were unable to obtain more detailed topographical data of the districts, so we had to reference satellite data from Google maps to confirm the locations of certain geographical features. For example, the reason for the large gaps in properties in the northwestern and western districts in Madrid is due to the presence of the Monte del Pardo Nature Reserve, as well as agricultural farmland in the west. With more data, we could have provided a better explanatory model on the differences in price in the districts.