📈 Data
In this section, we will be highlighting our data sources, data collection process, and the challenges we faced. We will also be providing a brief overview of our exploratory data analysis and data cleaning process.
📍 Data Sources
Idealista
Our primary dataset was obtained by using the Idealista API. Our objective was to obtain a set of 500 data points per city for rental properties and 1500-3000 data points for sale properties across each of the ten target cities. Below is a screenshot of the Idealista website displaying a property listing. This data can be obtained through the API as well:

📍 Data Collection
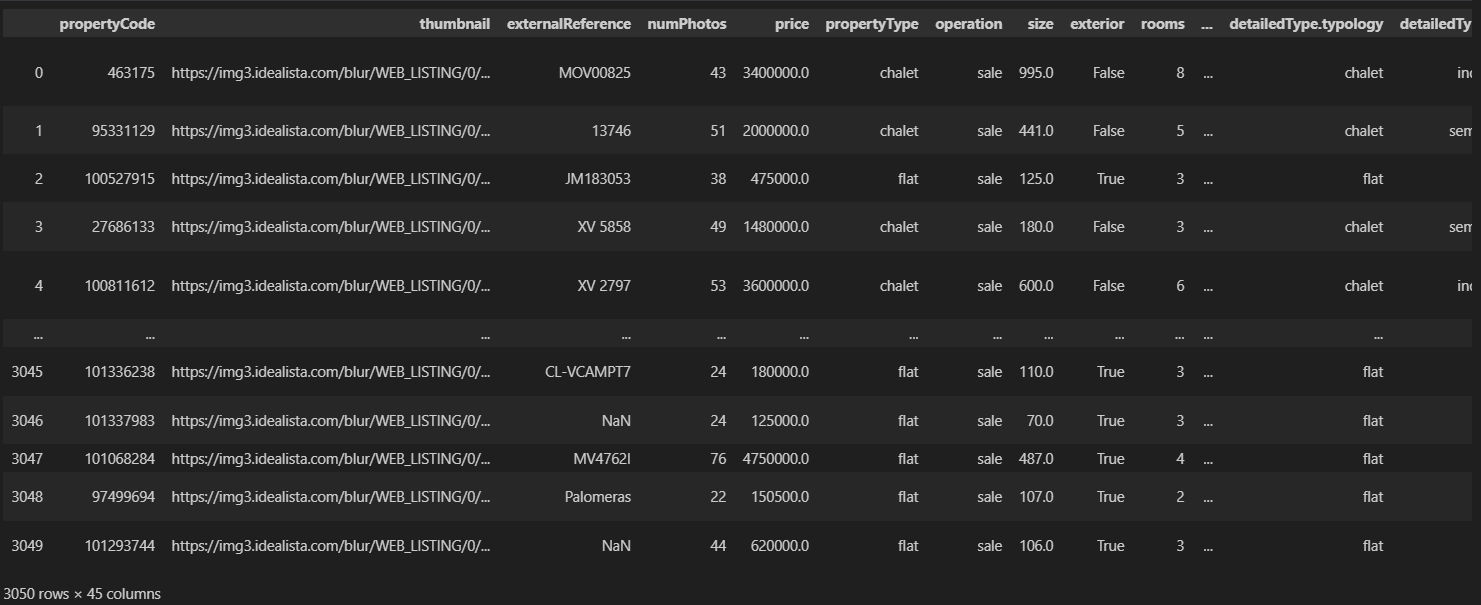
The primary Python library we used to collect the data was requests. In total, we collected 4,521 rental property listings and 16,550 sale property listings from Idealista. The Idealista API enabled us to obtain detailed property data on each listing on their page. The full datasets are available in .csv format on the Github repository. Below is a snippet of the data available to us after using the python requests library to obtain a dataframe through the Idealista API:
In addition, we also utilised data obtained from Statistia, macrotrends, and Wikipedia through web scraping as part of our preliminary analysis (see
reference). We employed data extraction techniques using BeautifulSoup to extract additional data from various other sources. This comprehensive process allowed us to obtain a robust and diverse dataset for analysis. Finally, we obtained two shapefiles of the cities of Madrid and Barcelona from the respective municipality websites in order to do some geographic analysis with the Madrid and Barcelona property datasets.
Challenges:
When collecting rental property data, we faced a significant challenge in a few of the smaller cities where the availability of rental properties within a reasonable radius was limited. Consequently, our efforts to gather the desired number of rental data points were hindered. Specifically, in Balears (Illes), Vizcaya, Zaragoza, and Las Palmas, we encountered difficulties as there were fewer than 500 data points available.
Another challenge we faced was that we initially had a limit of 1000 requests per month, significantly slowing down our data collection process. We managed to circumvent this issue by requesting for more API keys from Idealista, and strategically splitting up the requests over three months of work.
📍Exploratory Data Analysis:
As we did not obtain all our data from a singular data source, it is difficult to display all of our data at the same time below. However, below is a summary of the df_madrid_all data frame comprising of 3050 individual data points and 45 columns, providing sales data for properties in the city of Madrid:
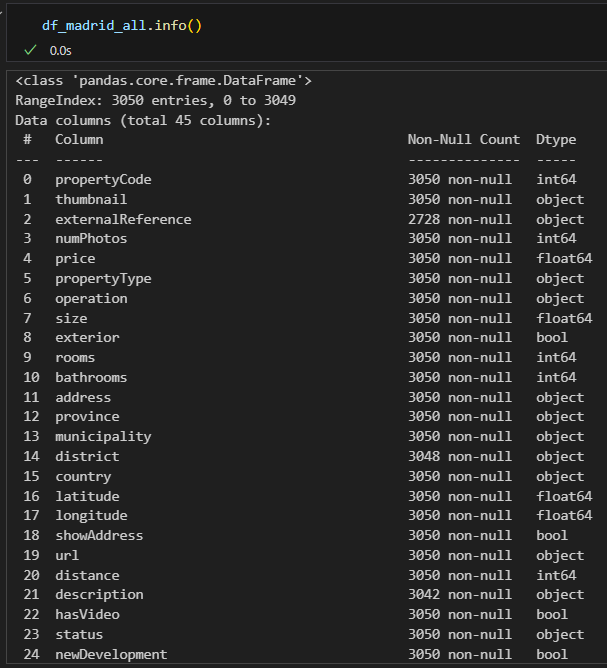
Relevant columns include the address, property price, size, price by area (not shown in the above image), and latitude and longitude.
Data Cleaning:
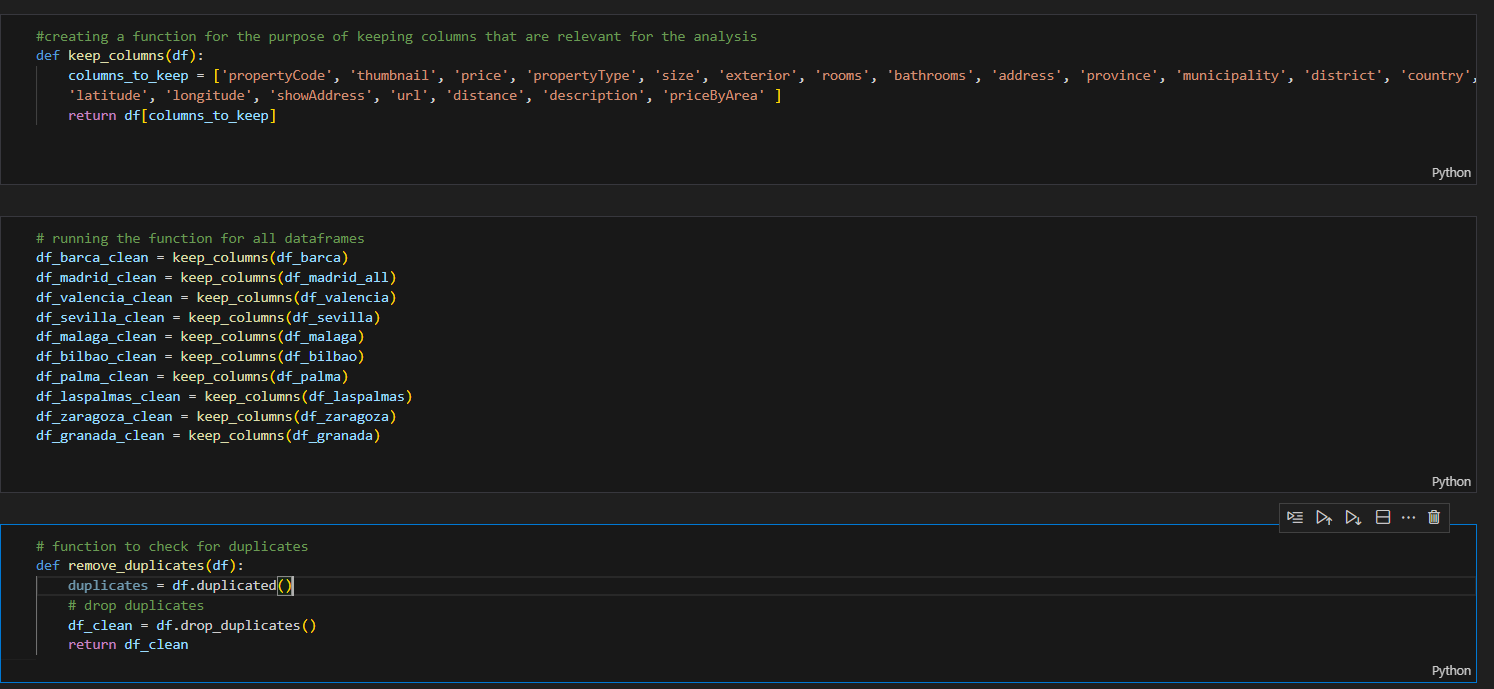
In order to provide visual representations of the data allowing for a clear and concise presentation of our findings, we first needed to clean the dataframes. Fortunately, not much work was needed as the API was clear and straightforward, but we still needed to remove duplicates, as well as columns in the datasets uneccesary to the data.
For the sales data, we removed a majority of the columns as they were not relevant to our data analysis. We also removed duplicates, as seen in the image below:
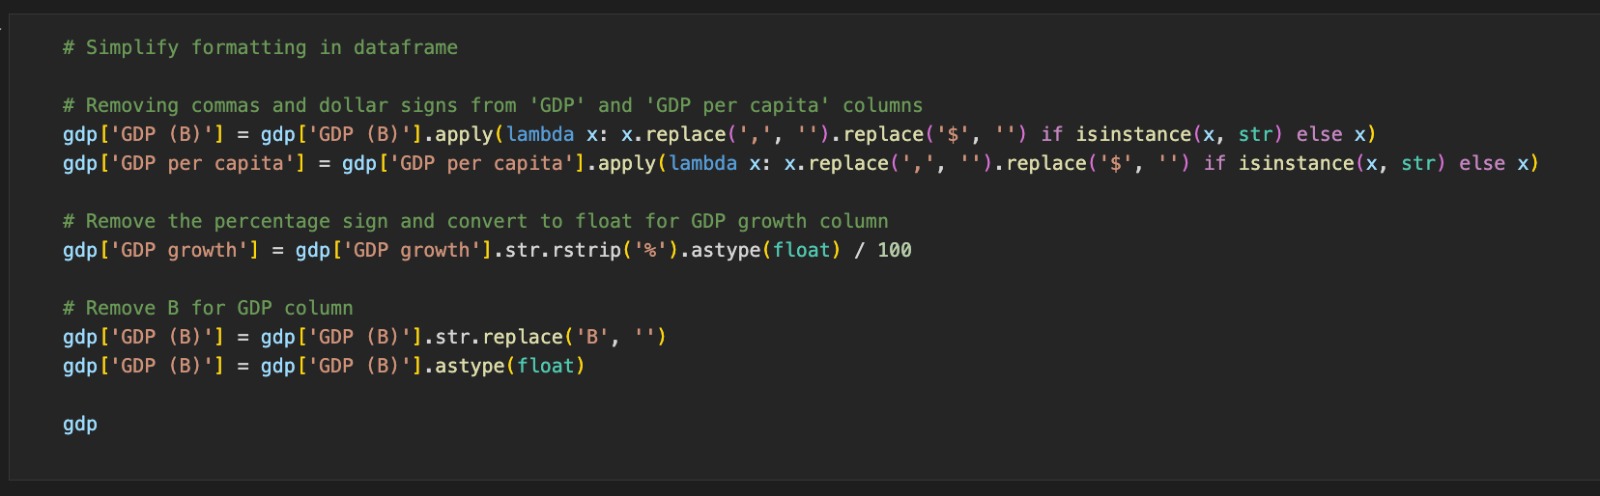
Additionally, when loading the shapefiles for the geographical analysis, we did encounter initial challenges performing the spatial join between the map shapefiles and the dataframes, and realised that we had to convert the shapefiles to the appropriate CRS in order to match the format for the latitude and longitude in the idealista dataframes. This is because there are many different coordinate reference systems employed by different countries and organisations, so we could only perform a join function on the map shapefile and the Idealista dataframe after we converted them to the same CRS format. For the rental data, we had to convert some of the data obtained from webscraping into regex, as well as remove unneccesary values in the data:
Following the data cleaning, we were left with a large but organised number of dataframes to work with, and our analysis of the data is in the following page.